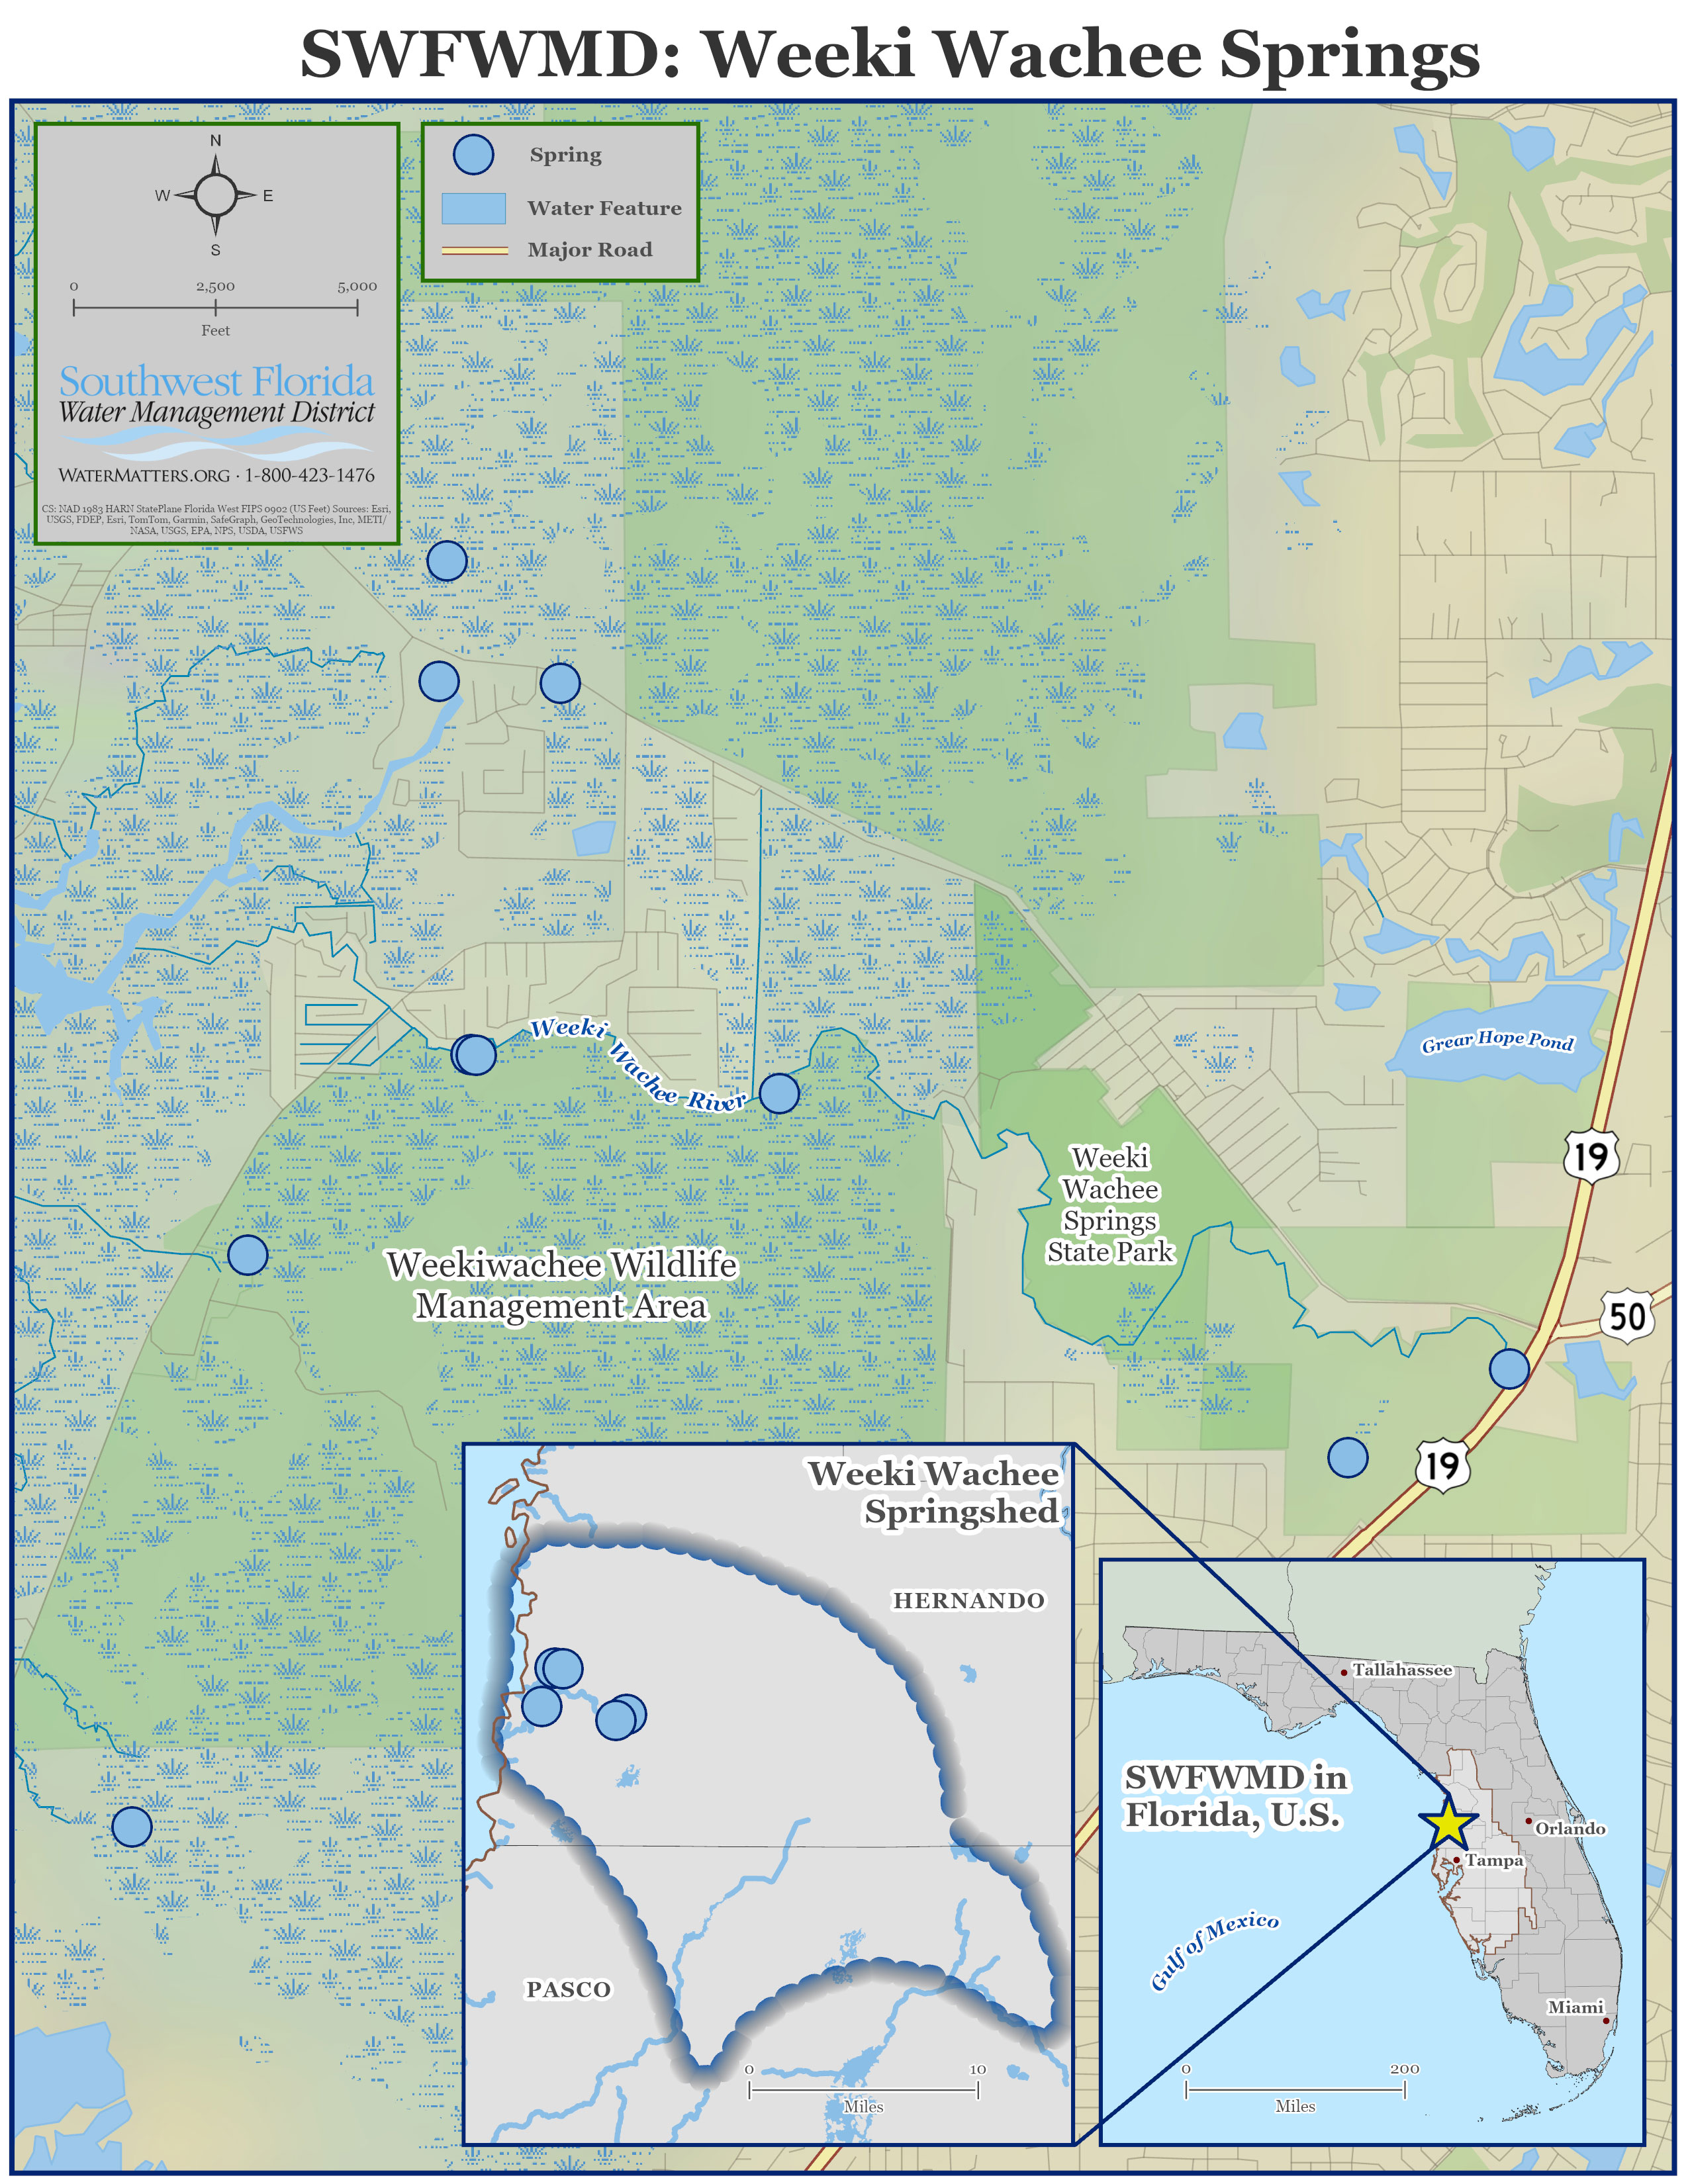
About the Springs
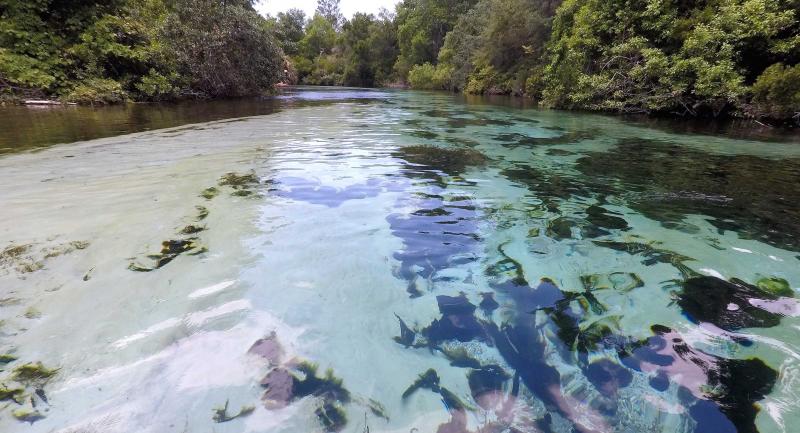
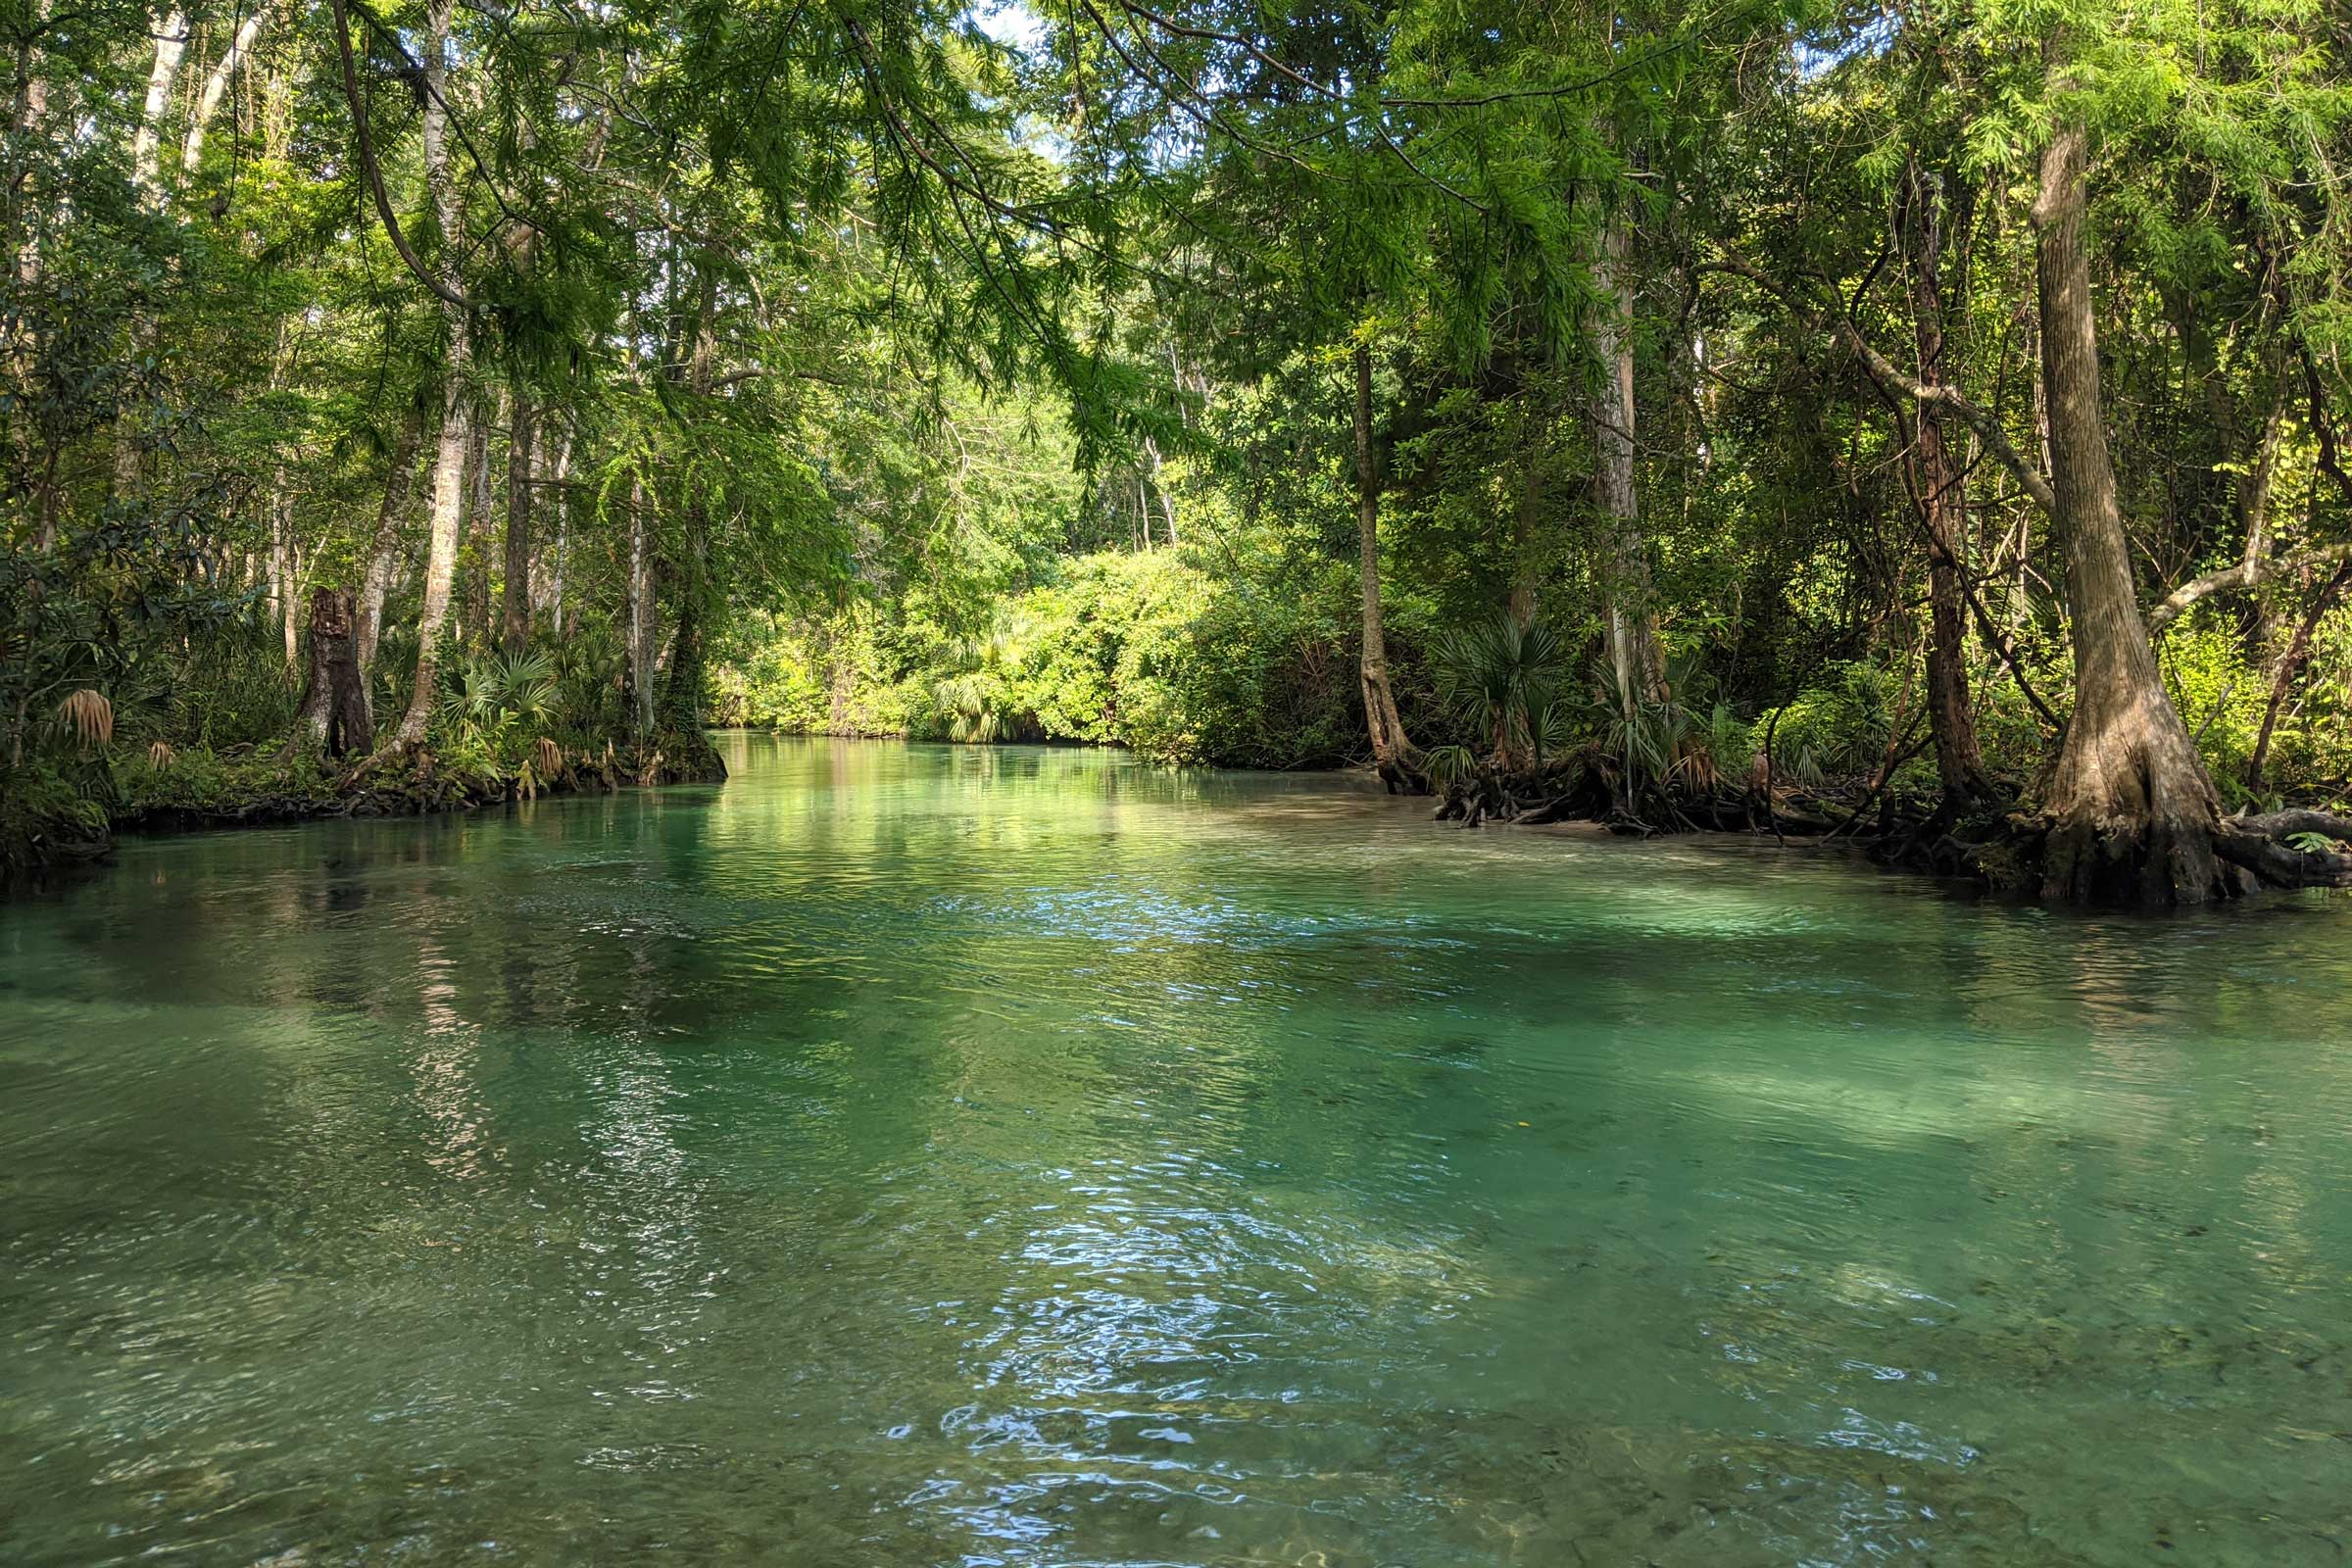
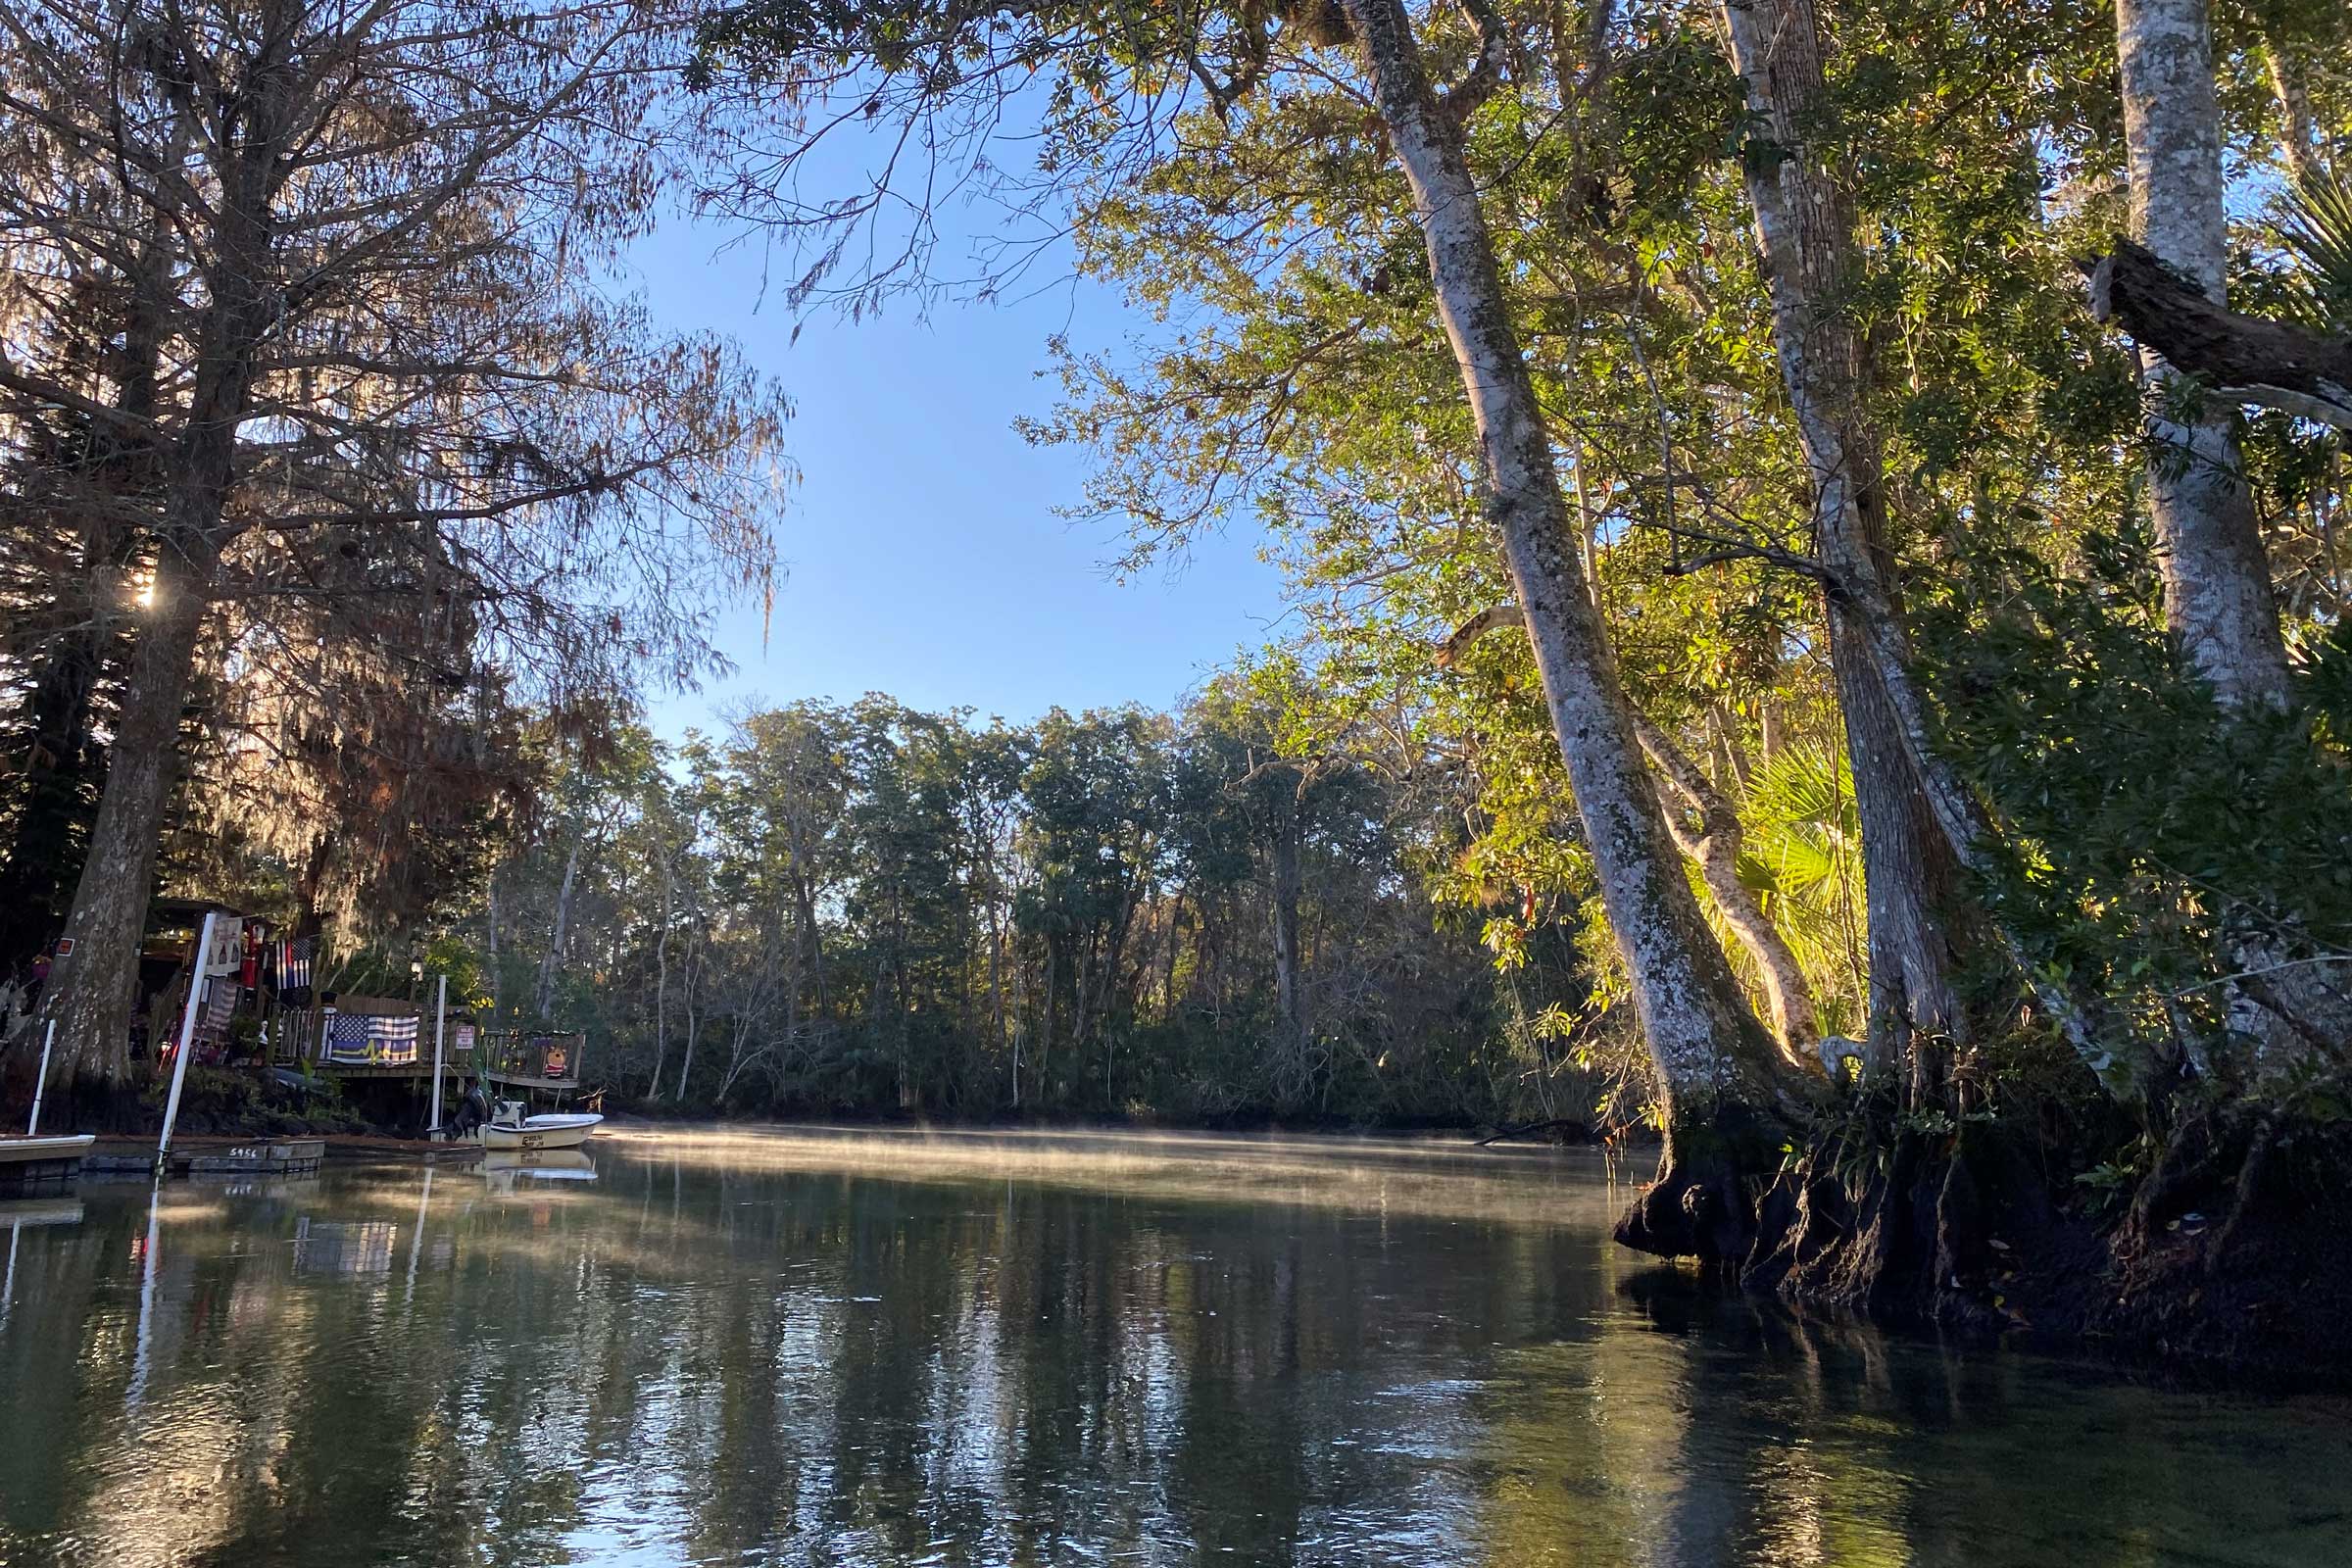
The Weeki Wachee River is a first-magnitude spring system originating in Hernando County. The headspring is home to Weeki Wachee Springs State Park, which features the historic underwater mermaid show. The river runs approximately 7.5 miles from the main spring to the Gulf of America. The lower section of the river has been dredged and channelized with canals for riverfront homes and businesses.
Several springs make up the Weeki Wachee River system. The majority of the river’s flow is from Weeki Wachee Springs. This spring’s pool is shaped like a cone with gentle slopes measuring over 150 feet in diameter and 45 feet deep at its center. A fracture extends below the pool and connects to the extensive cave system. Little Spring, also known as Twin Dees Spring, provides flow to the river from its tributary run downstream of the main spring. Mud Spring forms the headwaters of the Mud River, which joins the Weeki Wachee River near Bayport.
The Weeki Wachee springshed, which contributes groundwater to the Weeki Wachee spring system, is approximately 240 square miles and covers a significant land area in northern Pasco County and southwest Hernando County. Rainfall in this region directly affects the amount of water discharged from the springs by impacting the water level in the aquifer, which provides the driving force for spring flow.
Challenges
The primary issues facing this system include nitrate enrichment, sedimentation, potential decreases in historical flows, and decreases in desirable aquatic vegetation. Nitrate concentrations are higher compared to historical concentrations for many of the springs in the Weeki Wachee River system. These elevated concentrations can have adverse effects on the ecosystem. Long-term spring flow is largely affected by rainfall patterns and to a lesser extent by groundwater withdrawals. The Weeki Wachee River system has an adopted Minimum Flows and Levels (MFL).
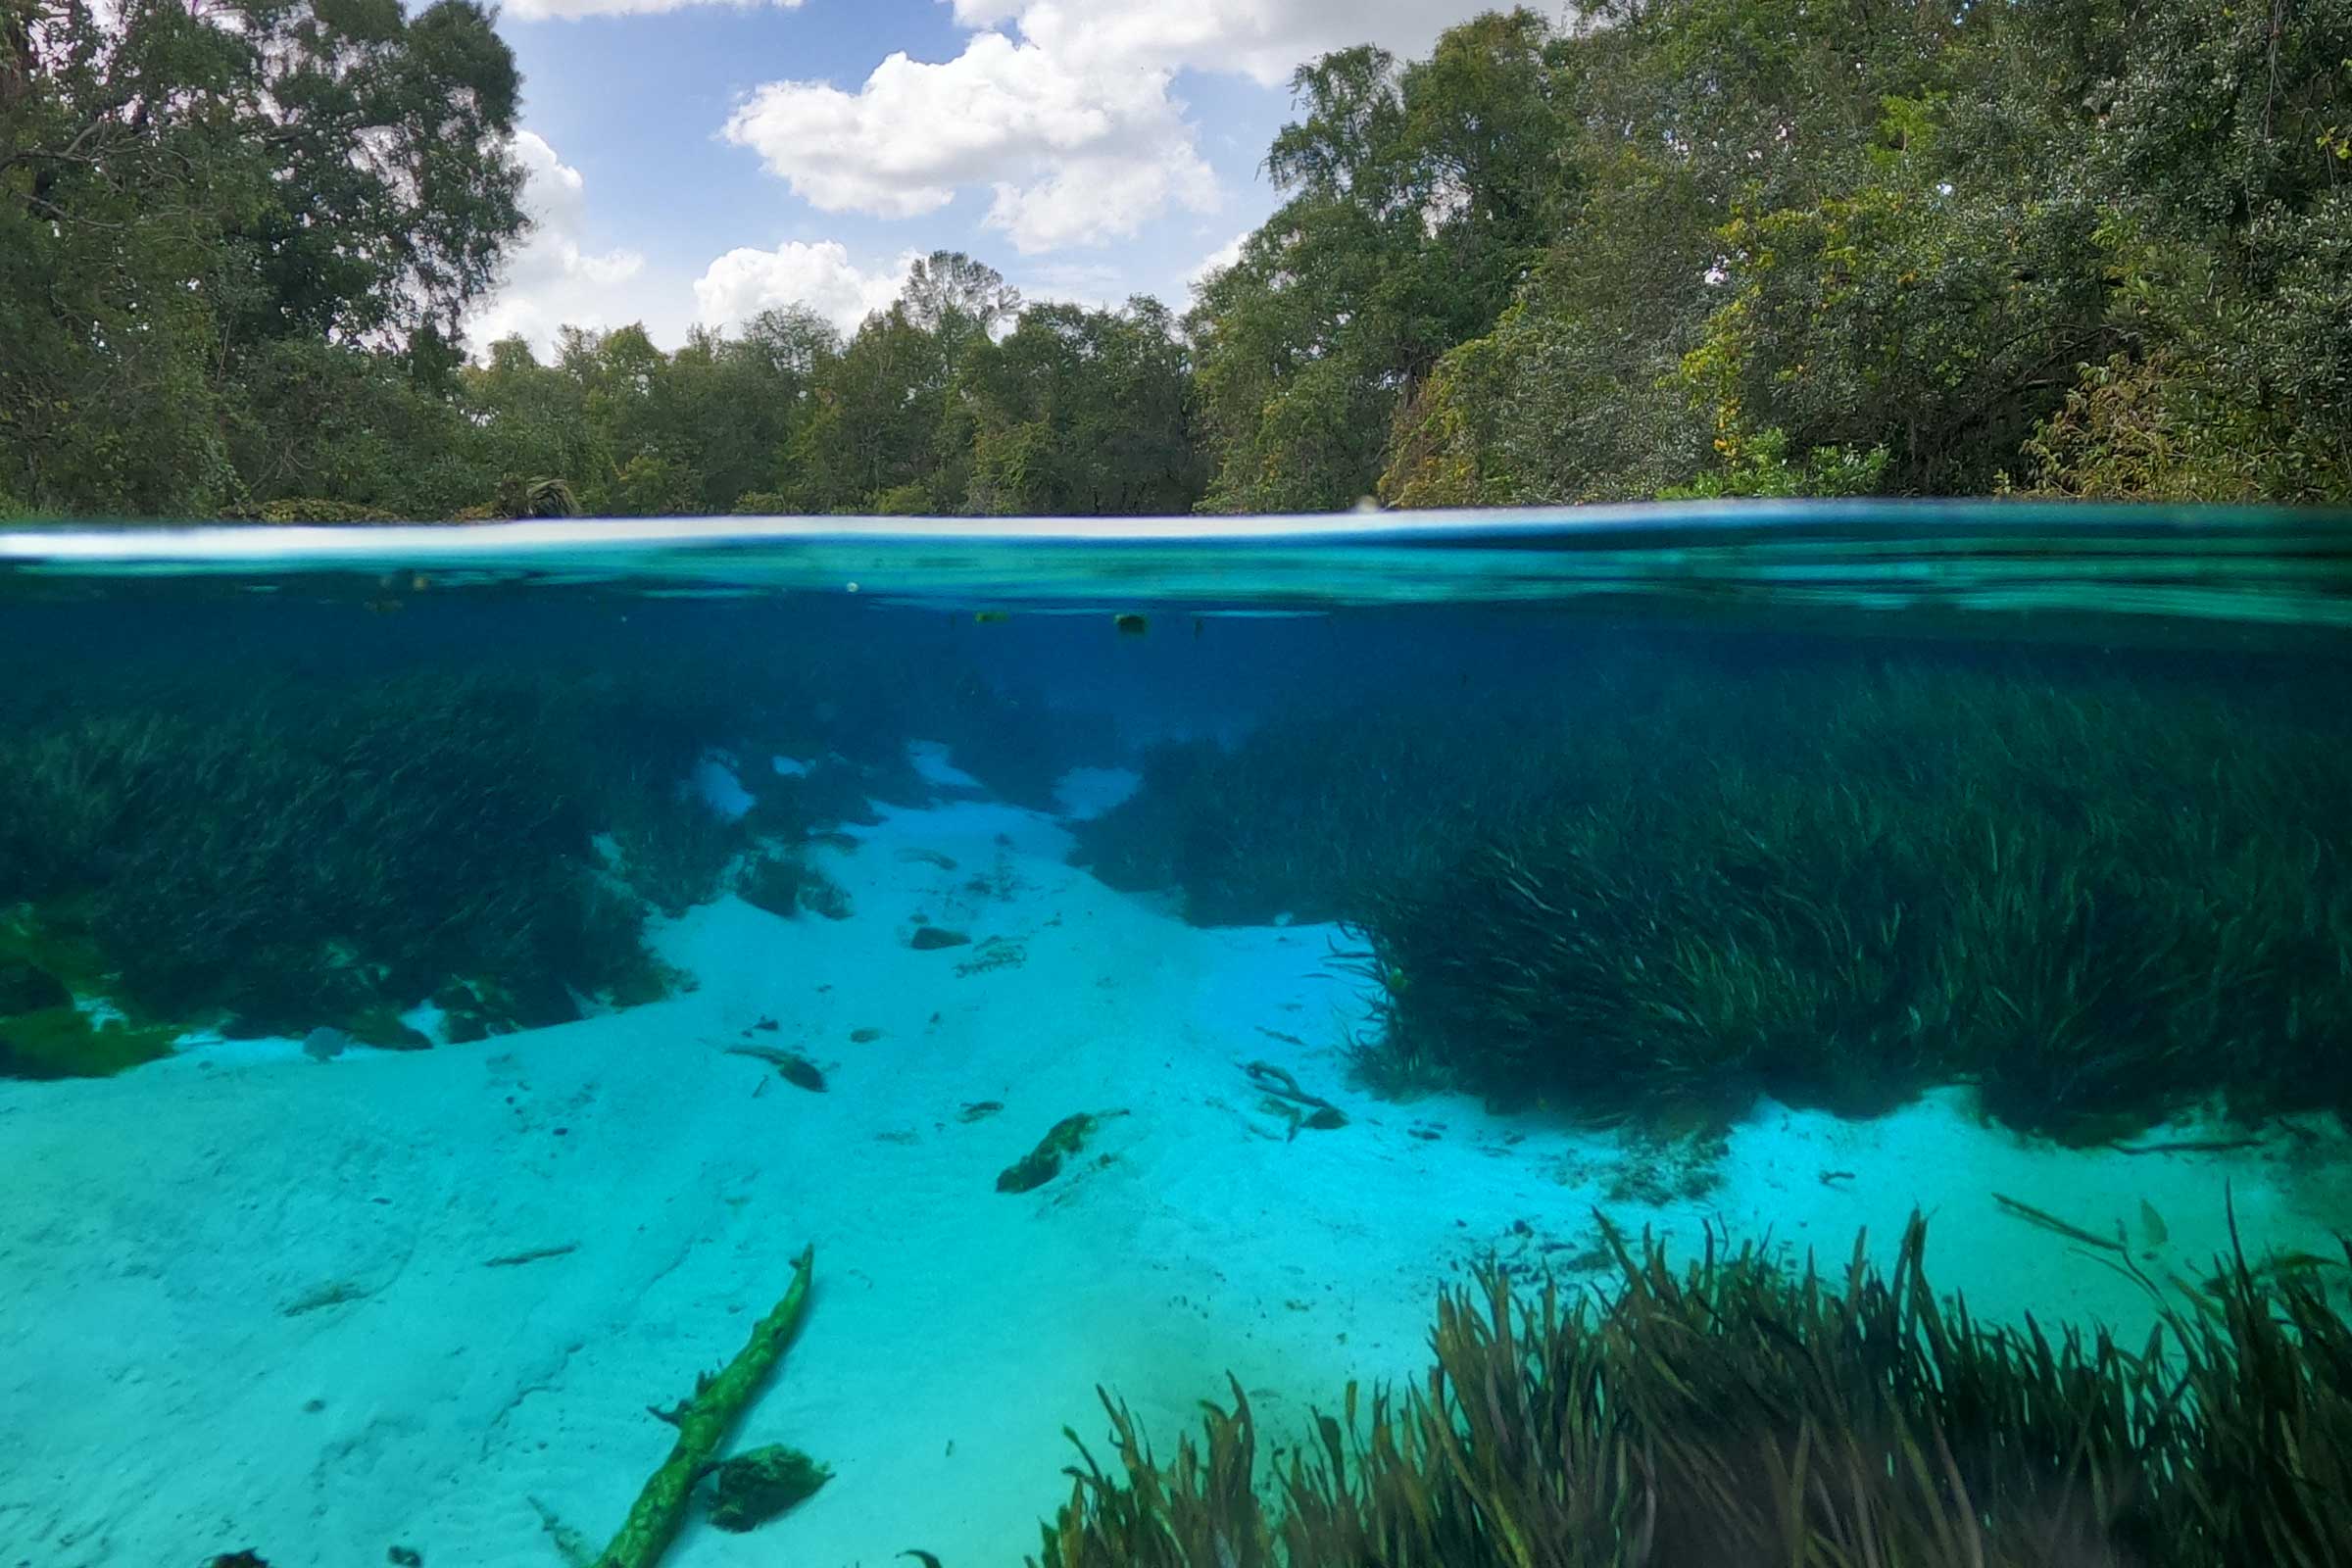
Changes in vegetation are likely due to a combination of drivers including invasive species competition, recreation and sedimentation. Sedimentation alters the river channel structure and can smother beneficial submerged aquatic vegetation. Changing salinity, particularly due to sea level rise and from frequent storm events such as hurricanes, is an emerging issue in the Weeki Wachee River. Increased recreational activities have had negative environmental impacts on the river by damaging vegetation and increasing erosion, which negatively impacts water quality.
Unique Features
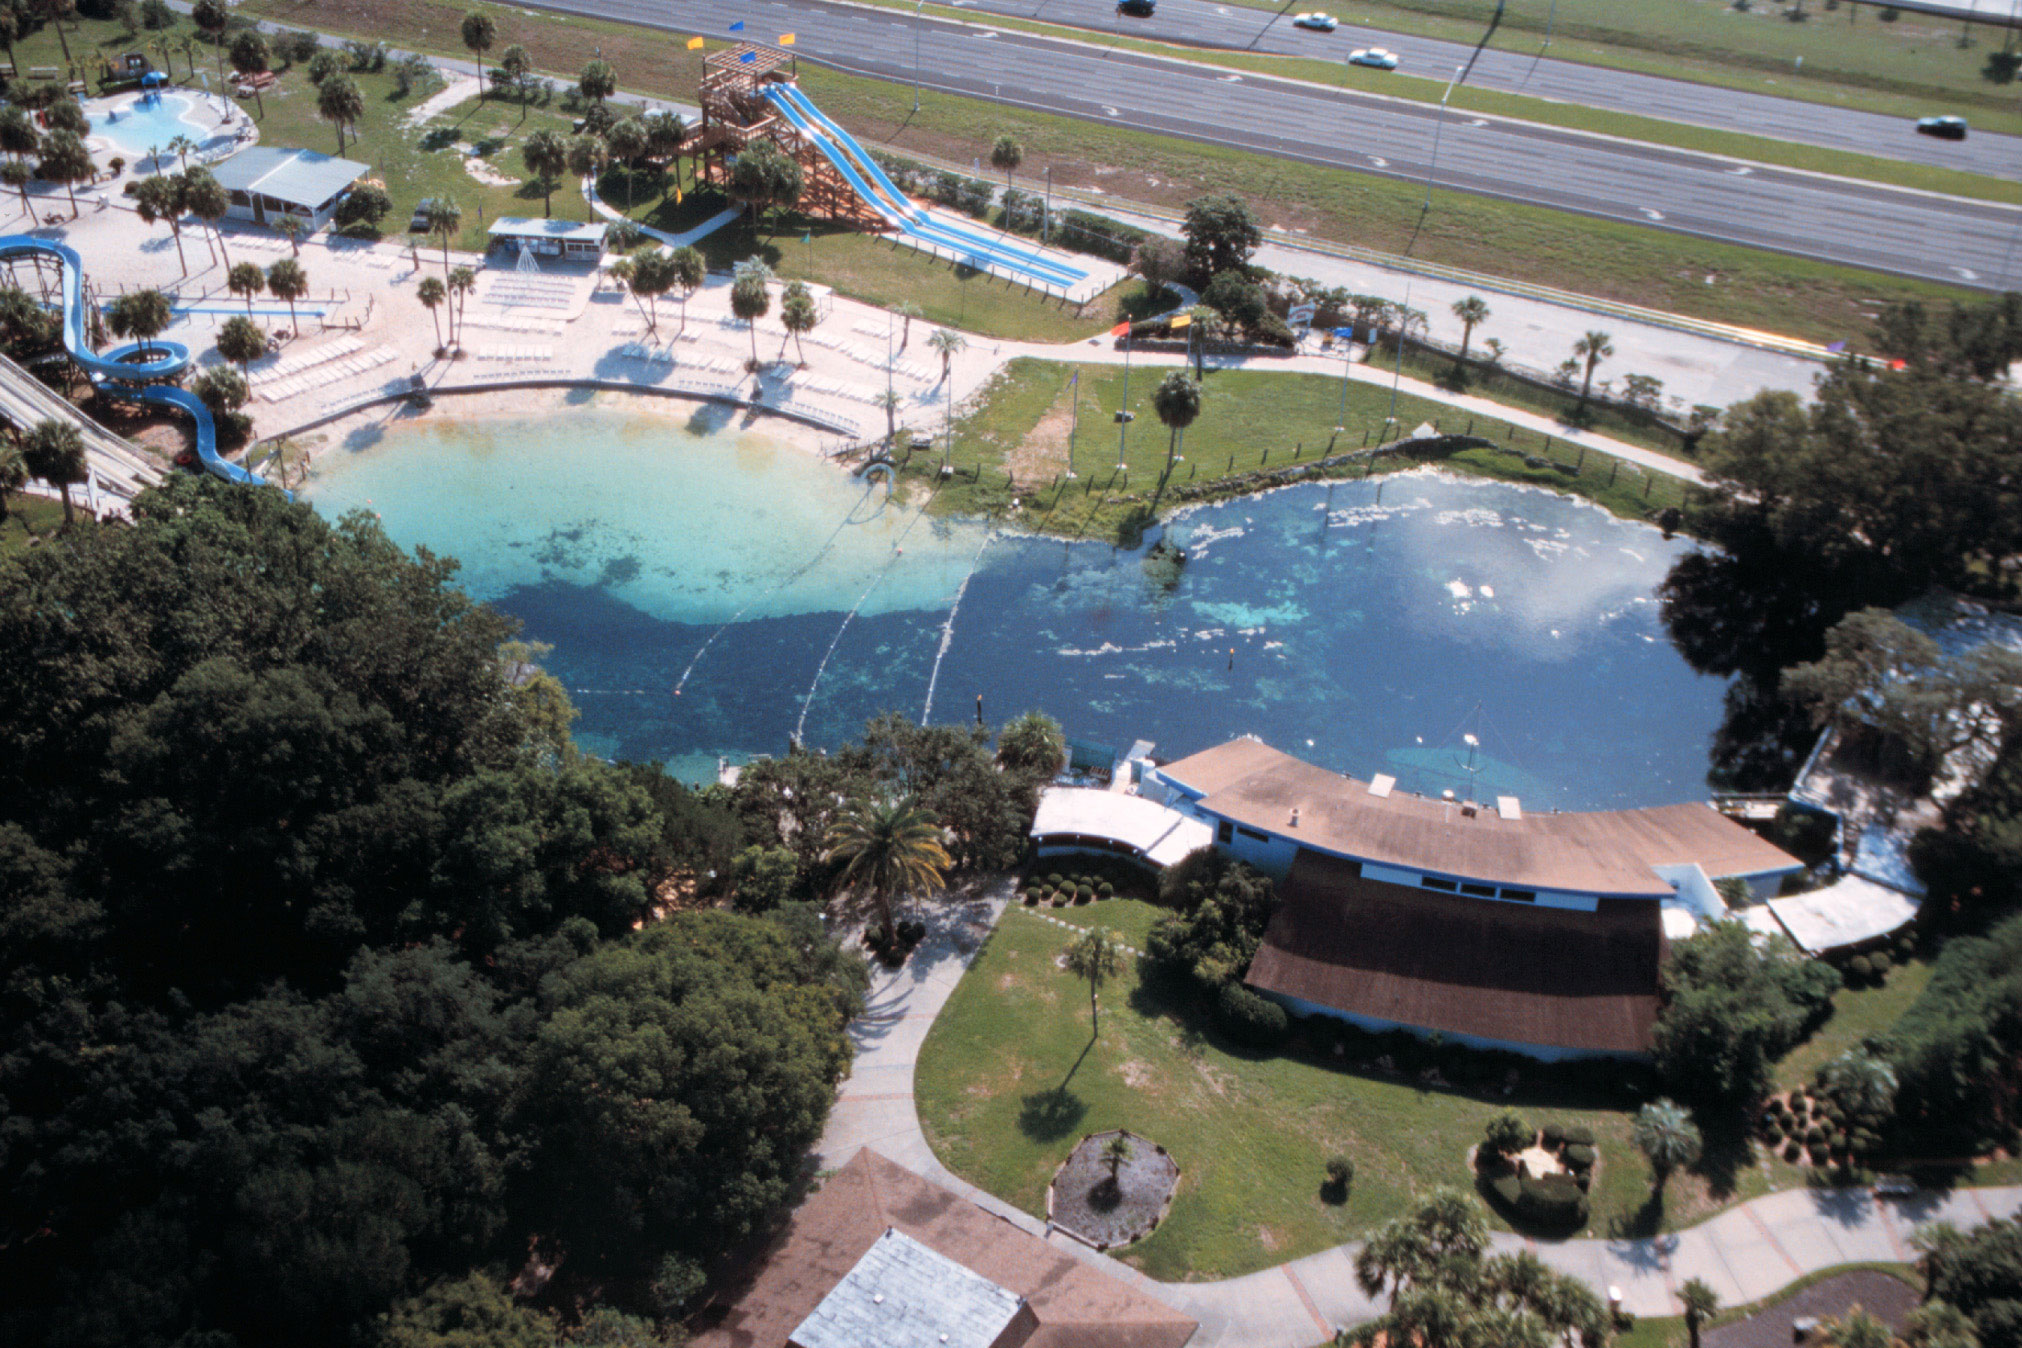
Weeki Wachee is best known throughout the world for its mermaids who have inhabited the main spring boil since 1947. In 2008, the State of Florida took over the private attraction and created the Weeki Wachee Springs State Park. In addition to mermaids, Weeki Wachee Springs is home to the deepest freshwater cave system in the United States. Its largest spring vent has an extensive underwater cave system that has been explored to depths of more than 400 feet.
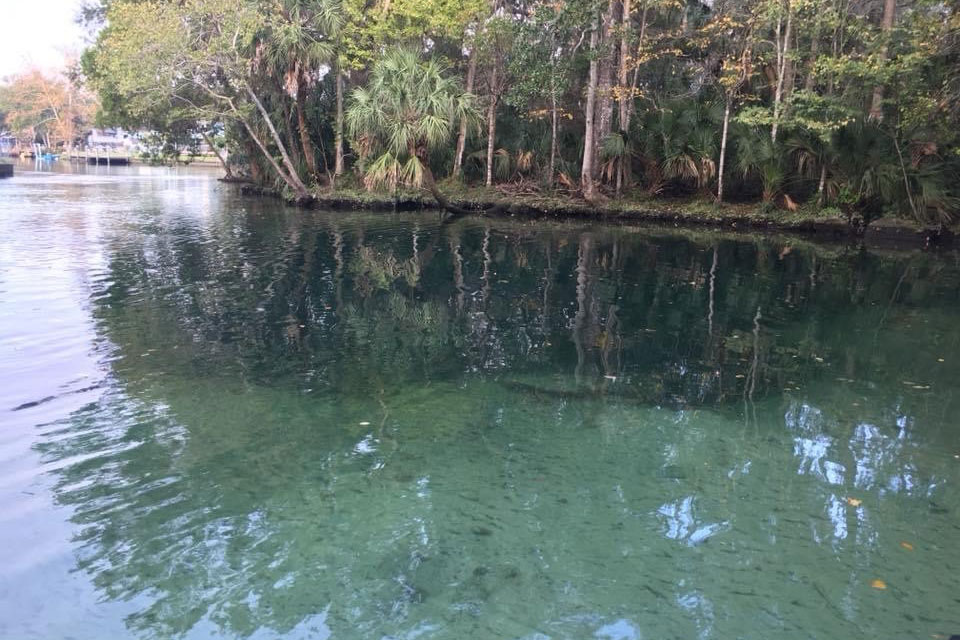
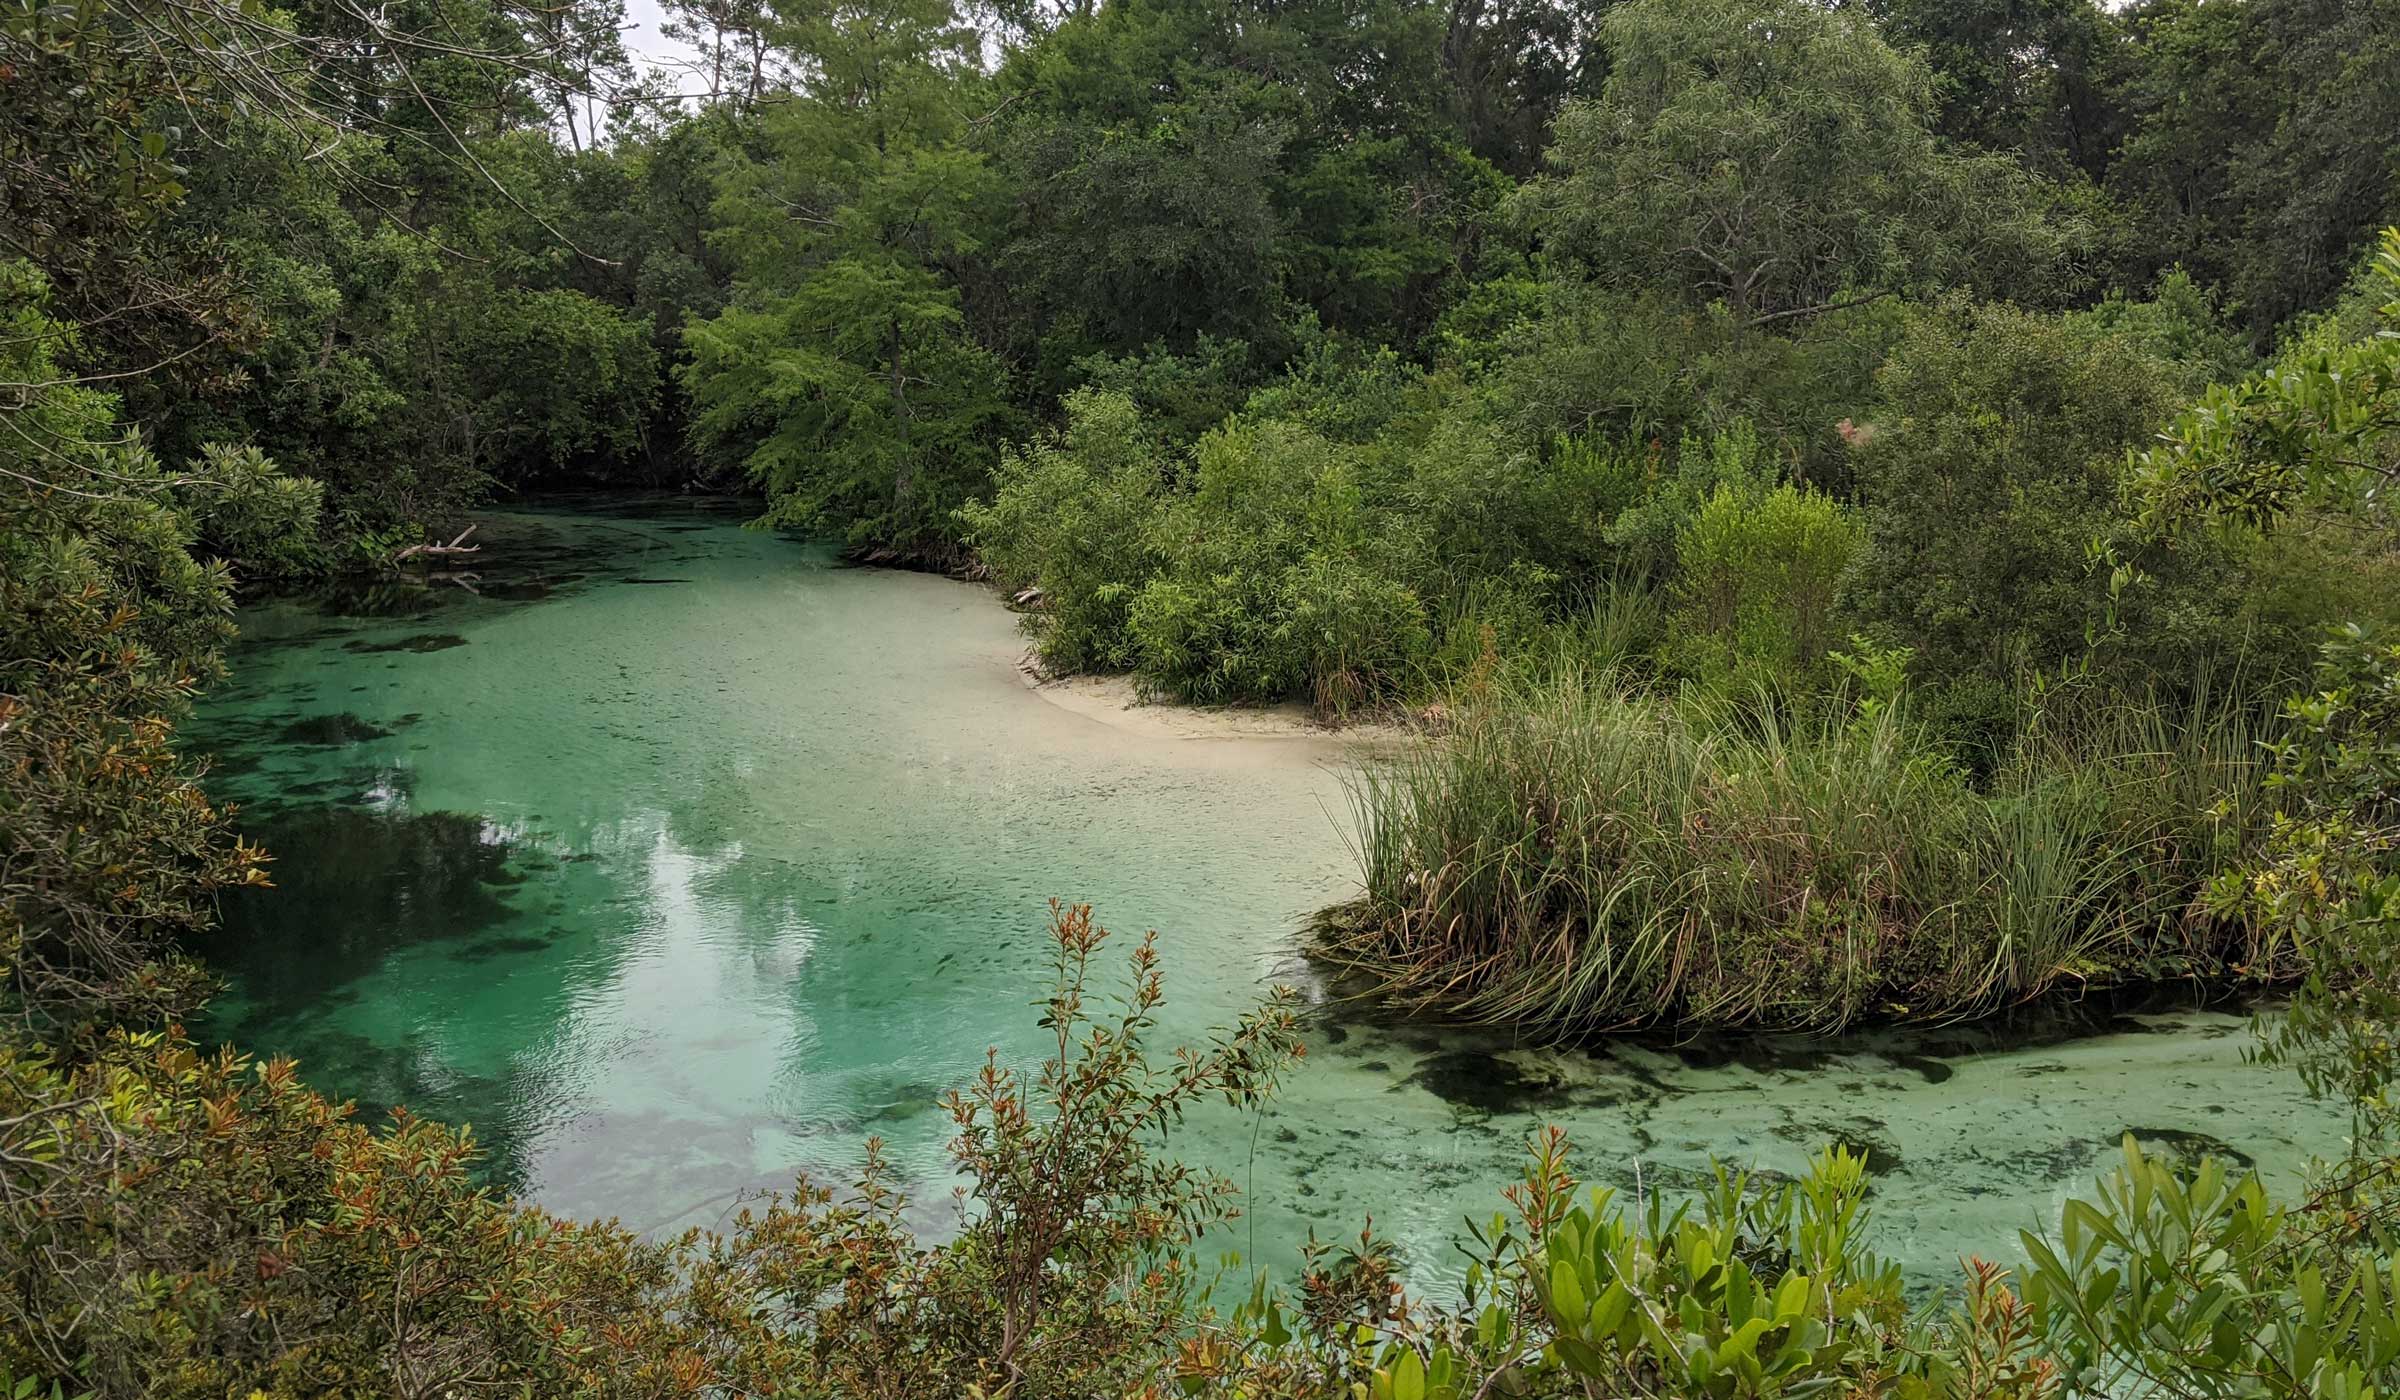
The upper portion of the Weeki Wachee River functions like a classic spring-fed freshwater river with no significant tidal influence. Near the Weeki Wachee River Gardens community, salinity is generally low, but the river exhibits tidal effects. Downstream of the Shoal Line Boulevard bridge, the river transitions to an estuarine river. This transition from a freshwater to a brackish river occurs relatively quickly when compared to other coastal spring-fed rivers.
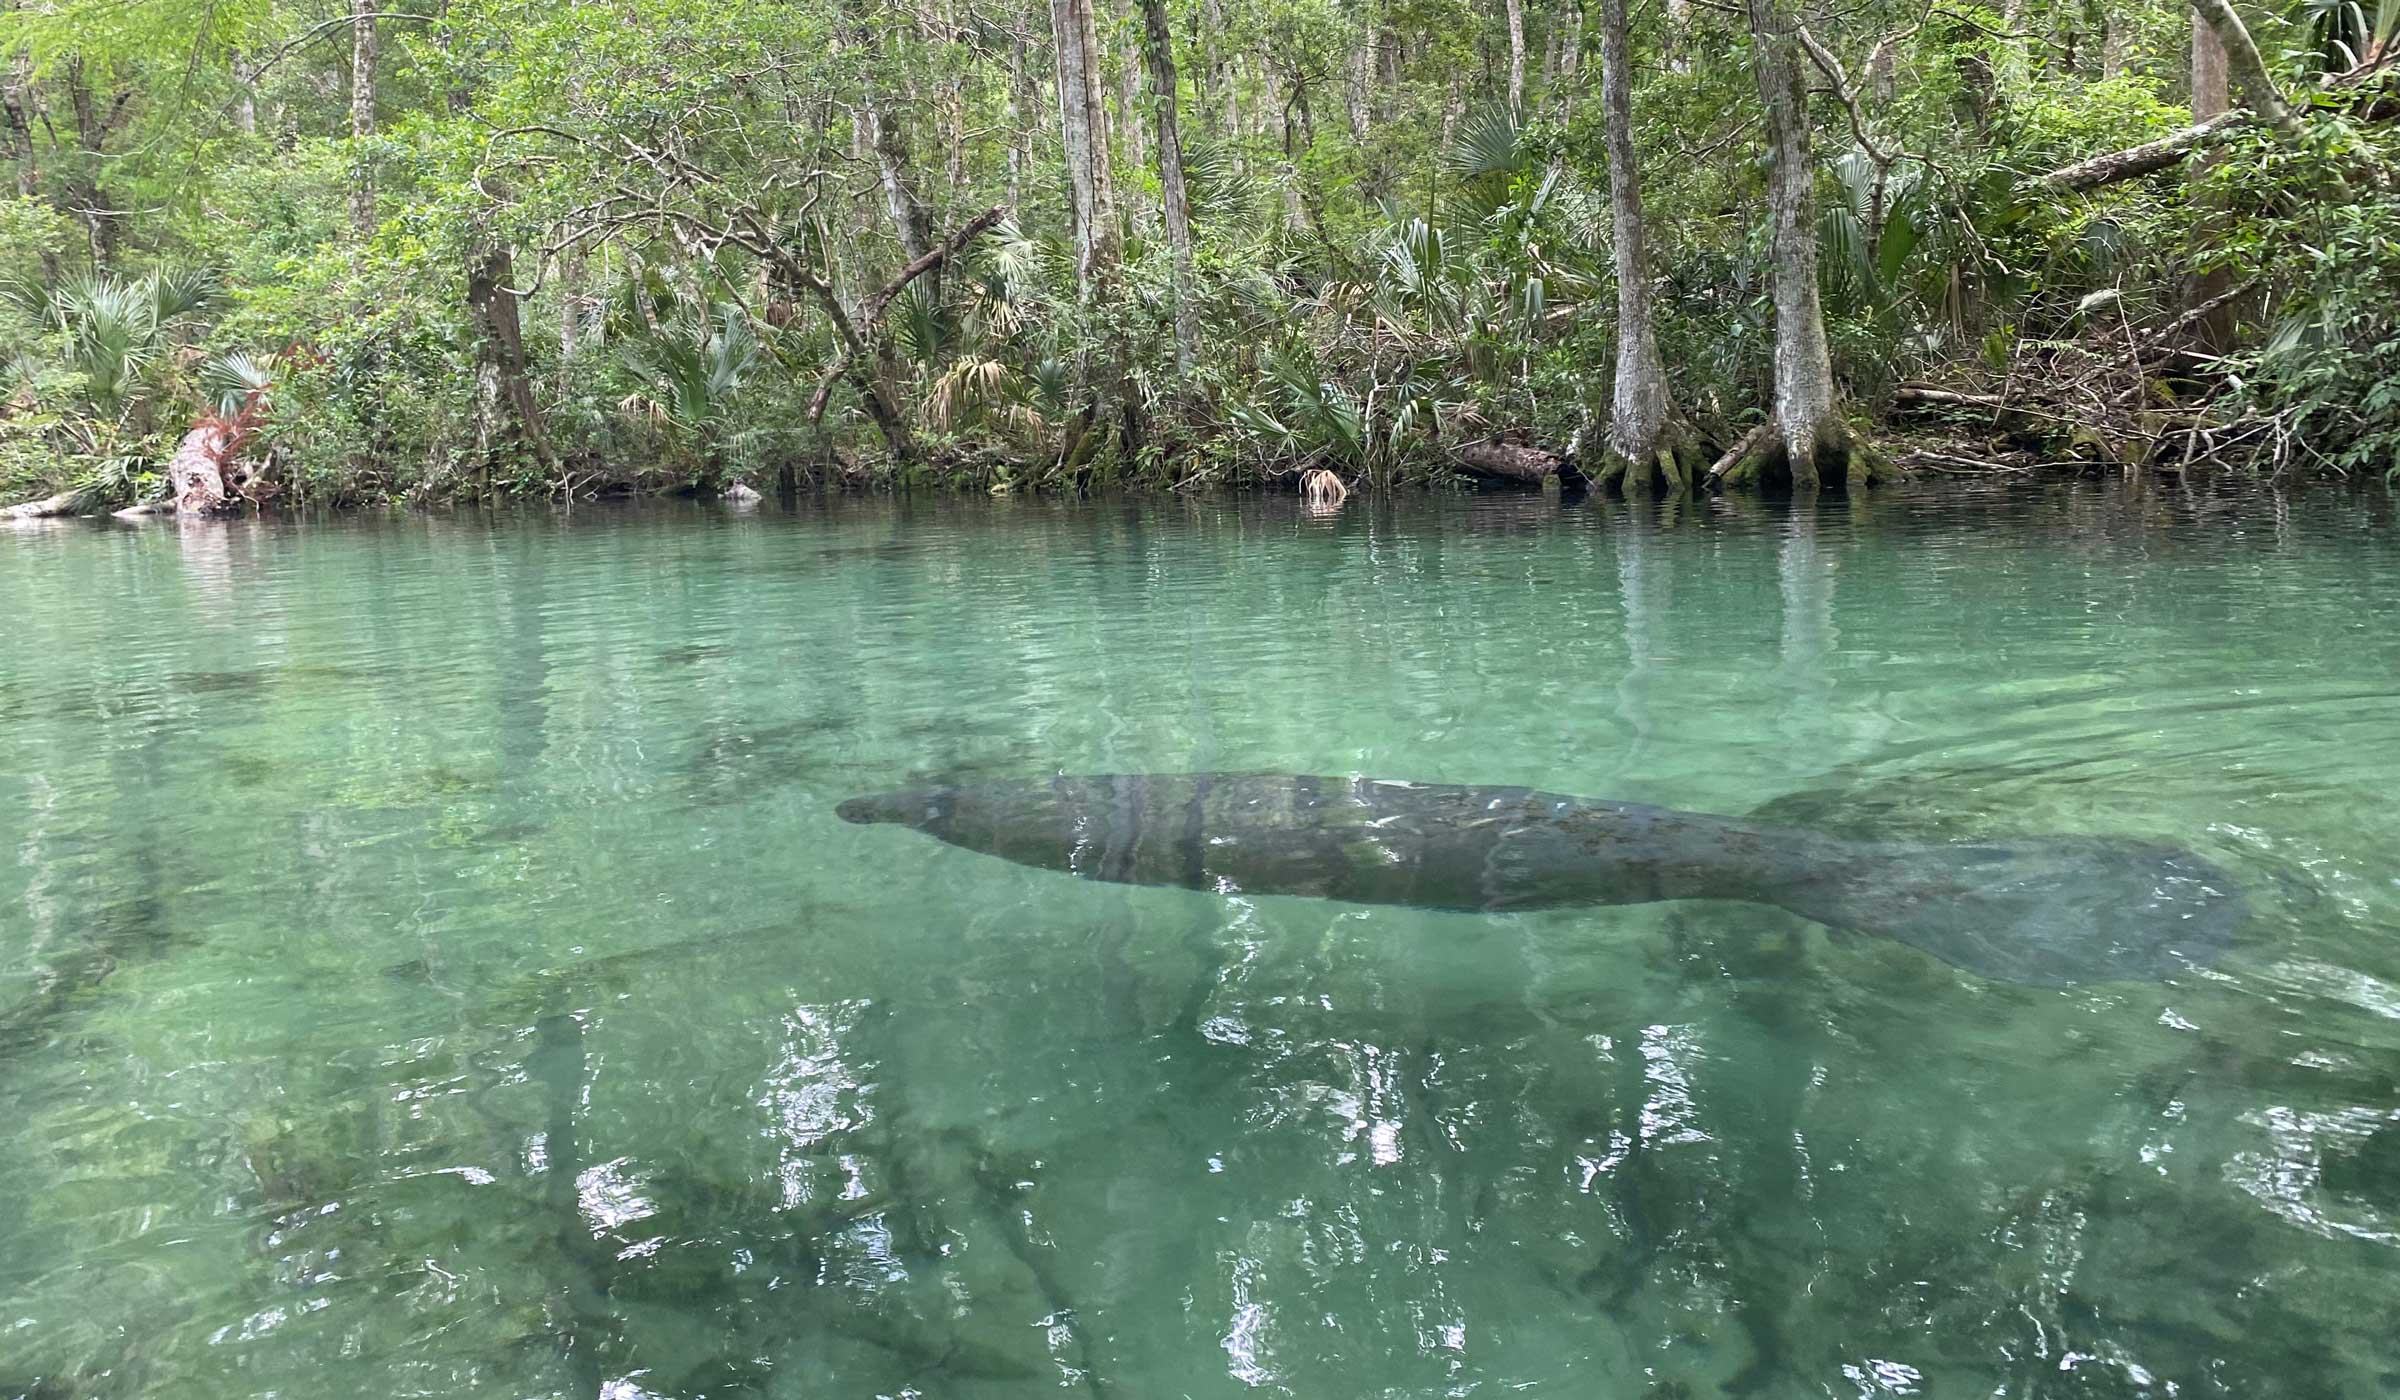
A submerged sinkhole called Hospital Hole, also known as the Fish Hospital, is located under the Weeki Wachee River. This sinkhole derives its name from a legend that sick or wounded fish come to the sinkhole to be healed. Hospital Hole is approximately 145 feet deep, depending on tide, is shaped like a sock and has a cloud-like layer approximately 70 feet deep. The water quality within Hospital Hole is different from the river, with low oxygen and brackish water. Though fish are not able to live within the sinkhole due to its low-oxygen, manatees can often be found within the sinkhole during colder months since the water in Hospital Hole is a couple degrees warmer than the river water.
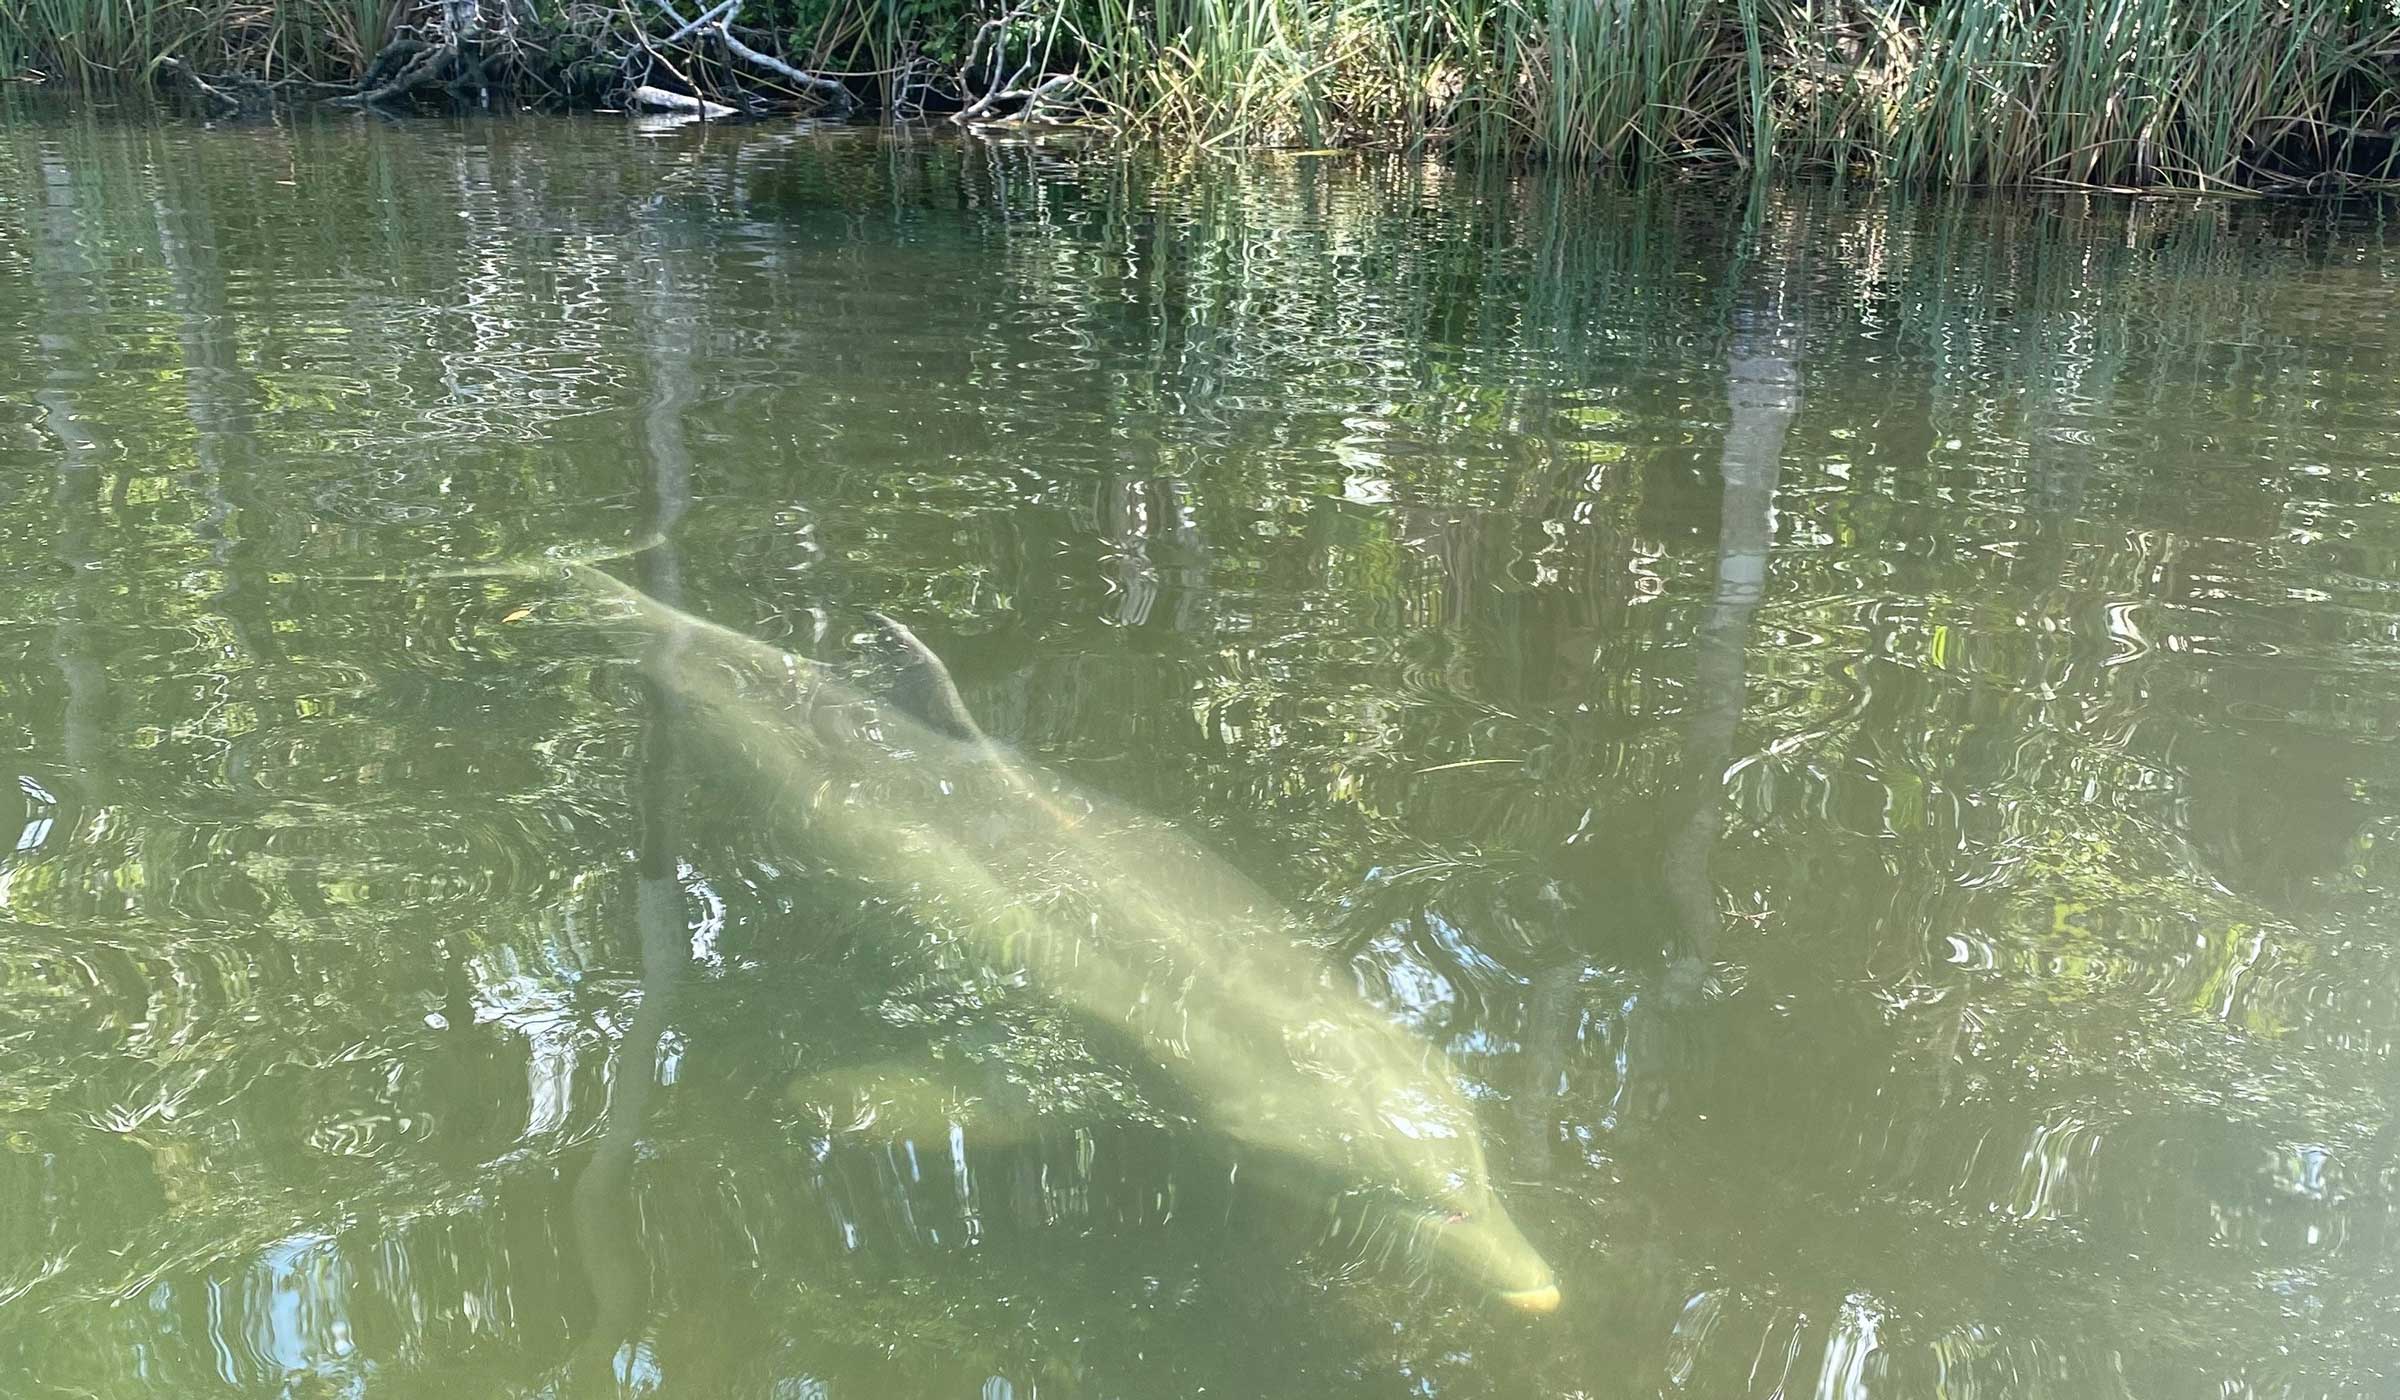
Salinity impacts the types of vegetation throughout the system. The type and location of submerged aquatic vegetation (SAV) will respond rapidly to salinity fluctuations. The river is home to both freshwater and saltwater species of animals due to the influence of the Gulf of America. Visitors can spot mullet, manatees, river otters, blue crabs and dolphins swimming in the river. Various birds, snakes and turtles may be observed along the banks.
Gallery
Click on any of the thumbnails to view the gallery slideshow.