About the Springs
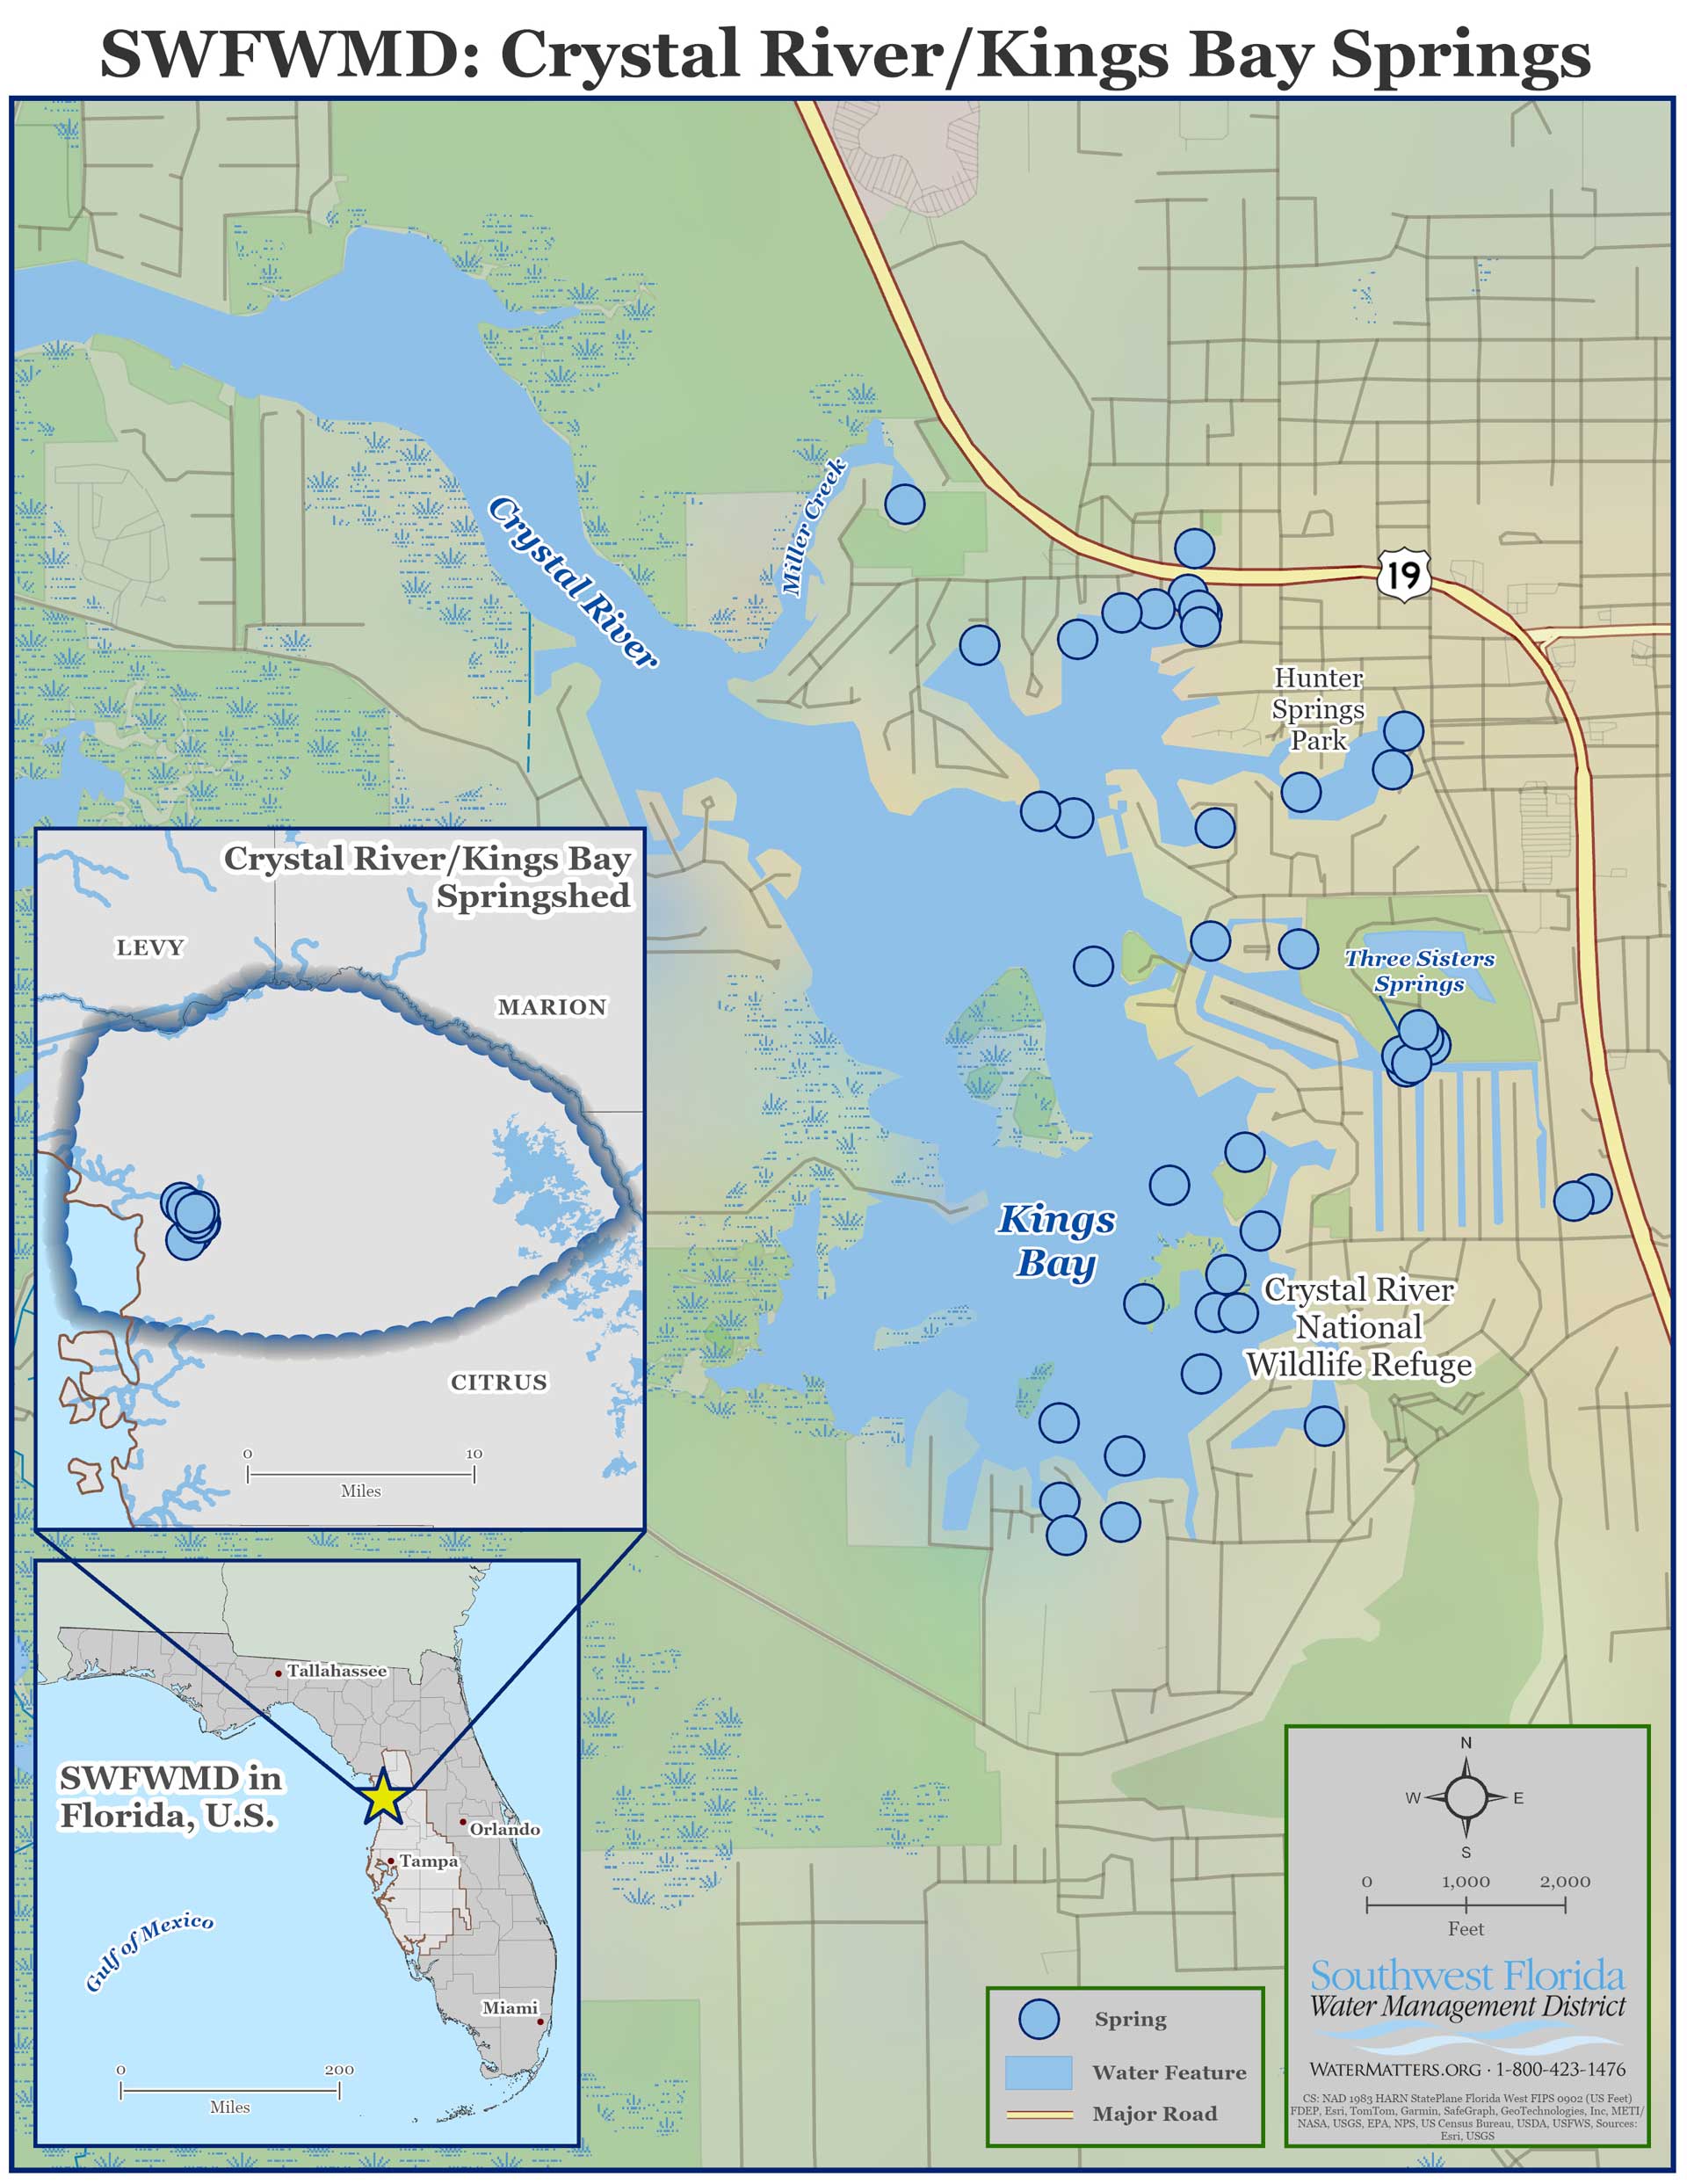
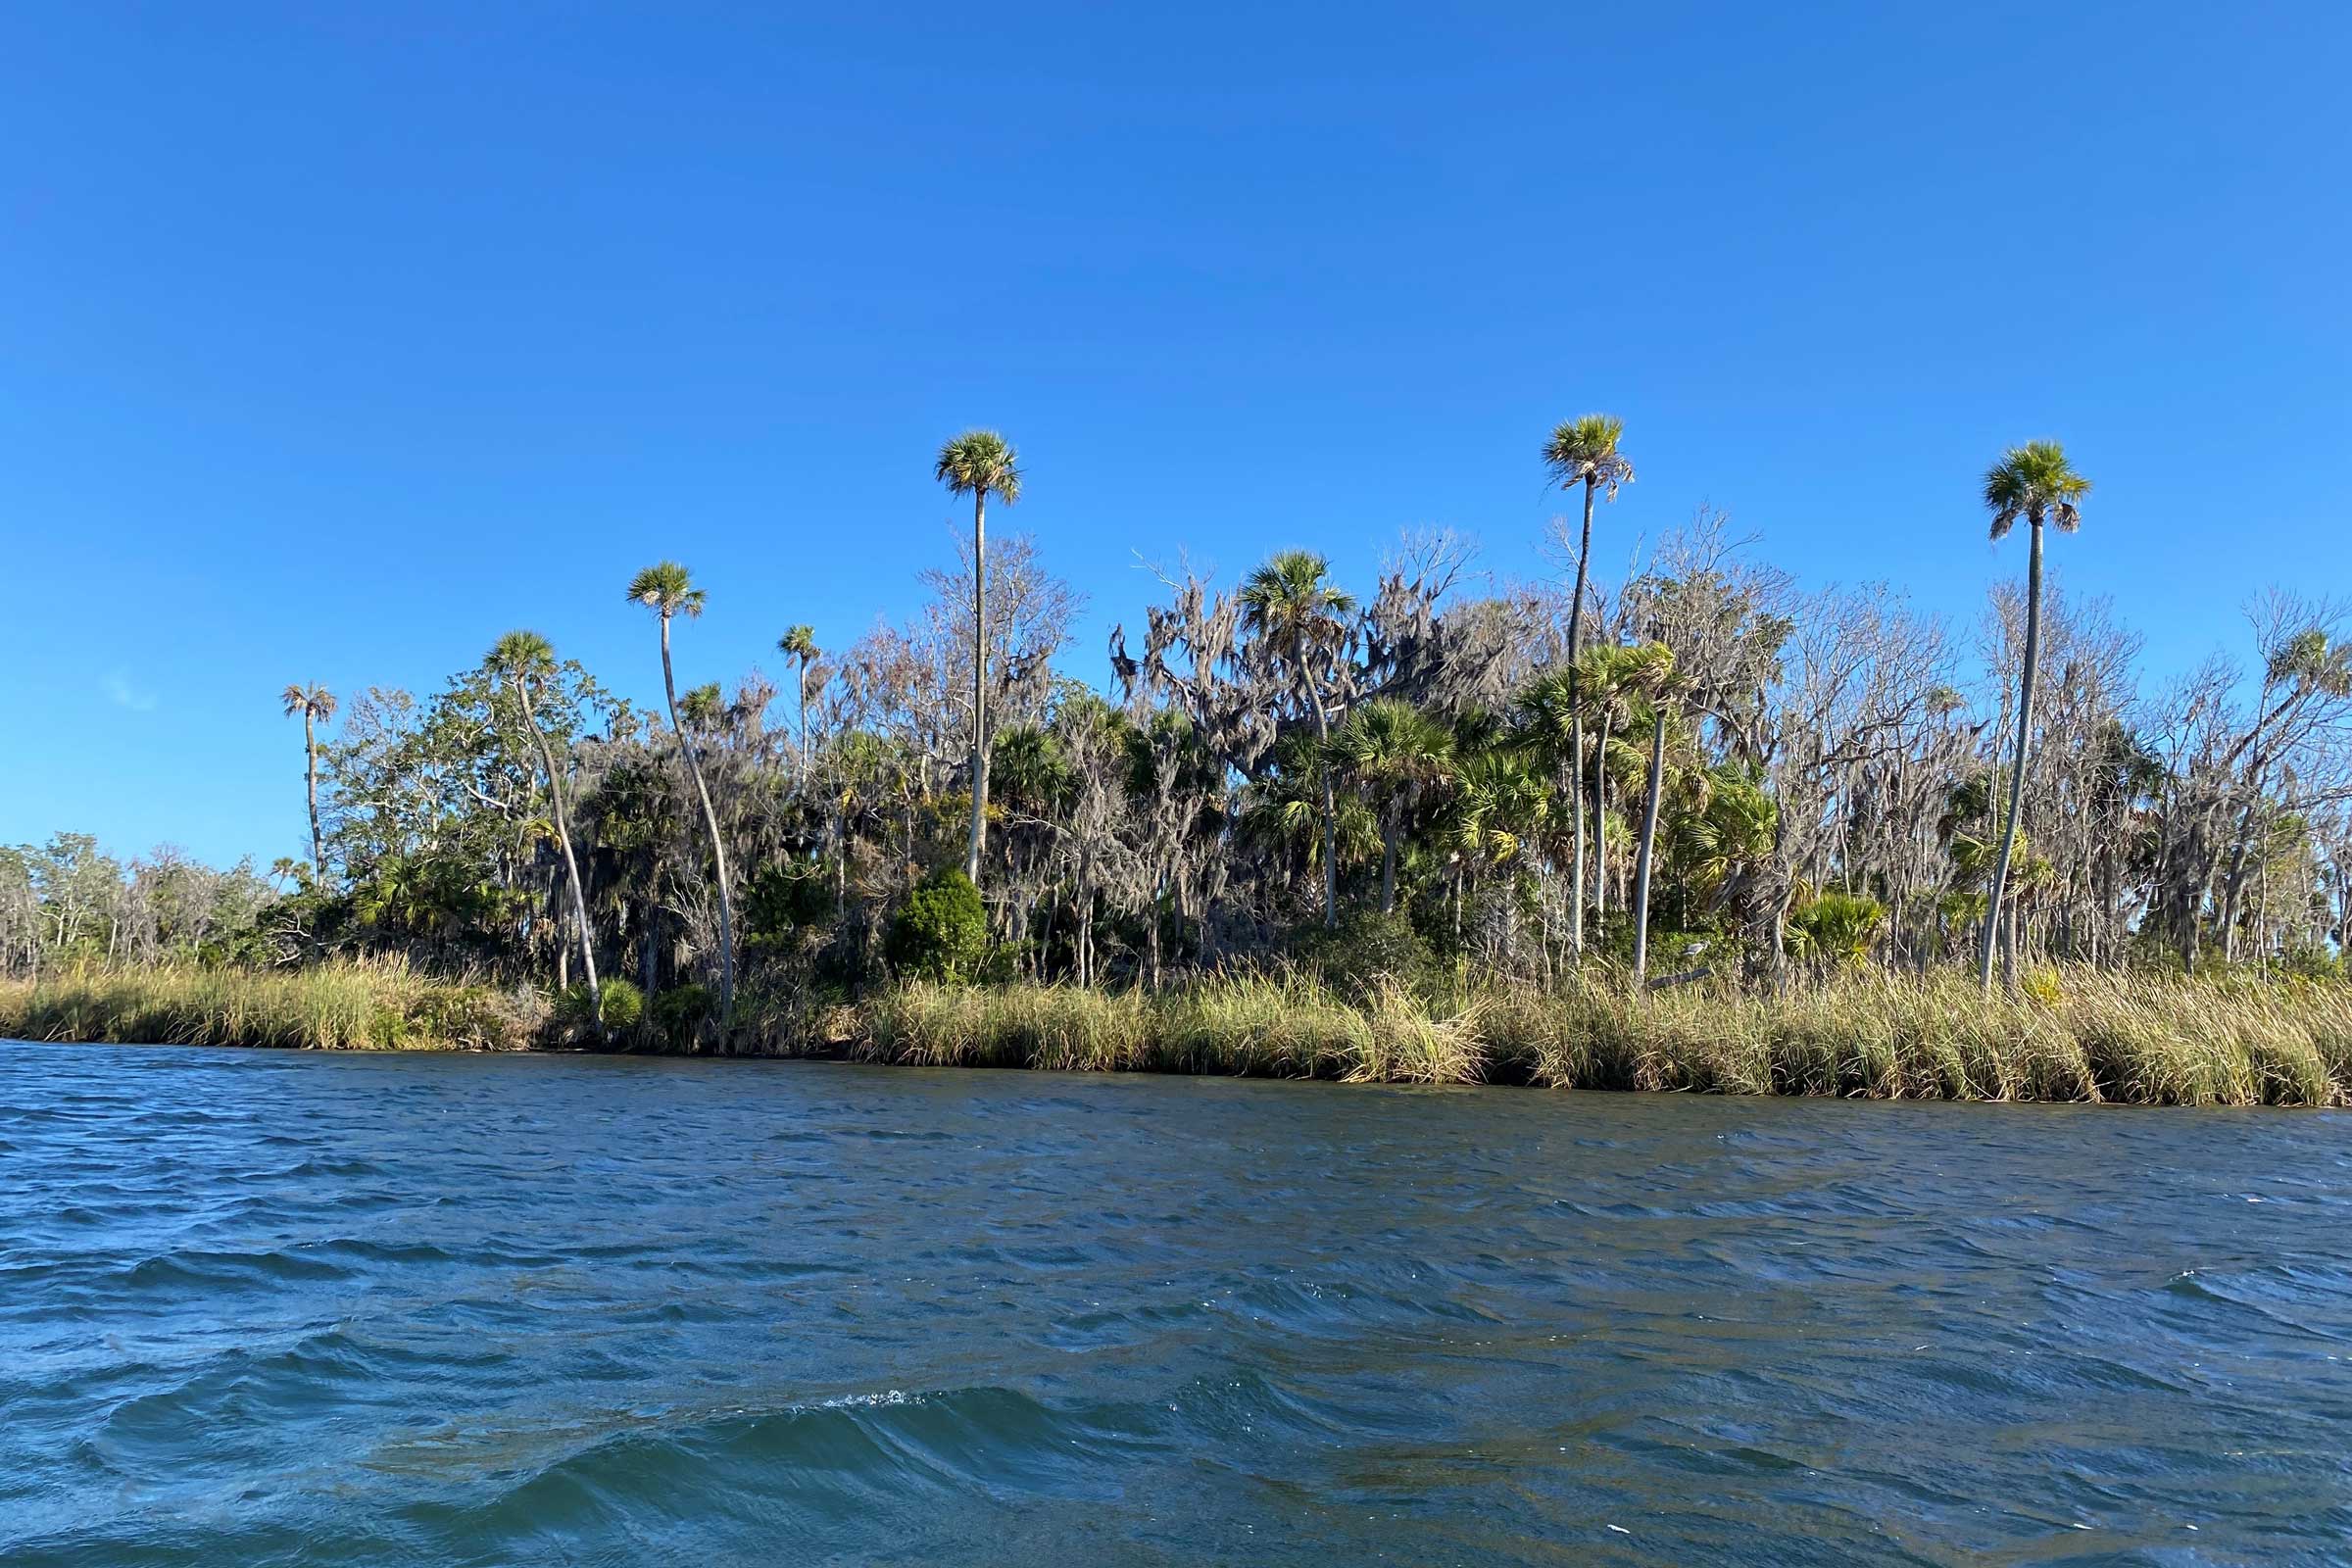
Crystal River/Kings Bay is a first-magnitude spring system that originates in Citrus County. Kings Bay is a 600-acre bay at the headwaters of the Crystal River, which is a tidal river that flows approximately six miles from the northwest side of Kings Bay to where it meets the Gulf of America.
Crystal River/Kings Bay is the second largest springs group in Florida and is comprised of more than 70 springs. Most springs are found in the eastern half of the bay, including highly visited springs such as Hunter, Tarpon Hole and Three Sisters. Because the source of water for each spring is different, water quality varies from spring to spring.
The Kings Bay springshed, which contributes groundwater to the Crystal River/Kings Bay spring system, is approximately 310 square miles and covers a significant land area in Citrus County. Rainfall in this region affects the water level in the aquifer which ultimately provides the driving force for spring flow, affecting the amount of water discharged from the springs. Due to its proximity to the Gulf of America, tidal stage also impacts the amount of flow from springs in Crystal River/Kings Bay.
Challenges
The primary issues facing this system include changes in water circulation and salinity, reduction of natural shorelines, nitrate enrichment, potential decreases in historical flows and decreases in desirable aquatic vegetation. Many of these issues are related to this system’s unique history.
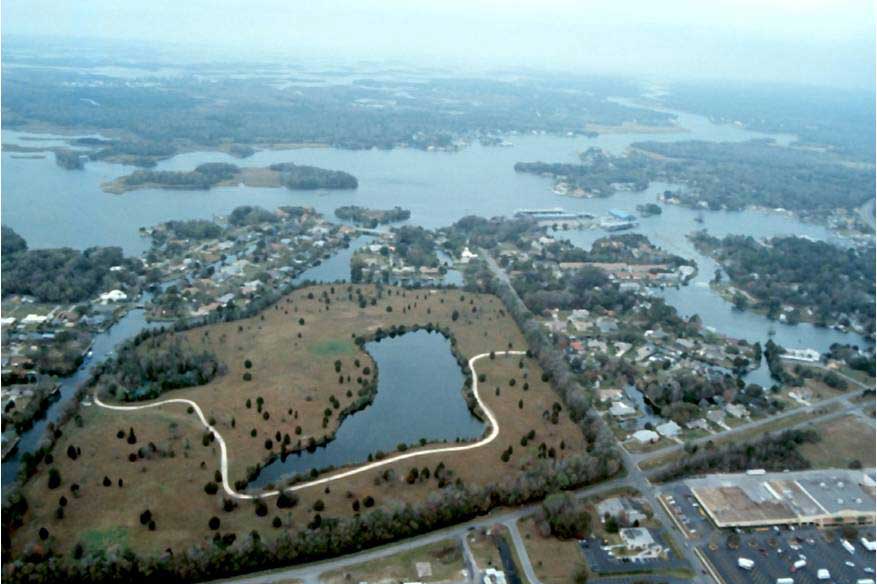
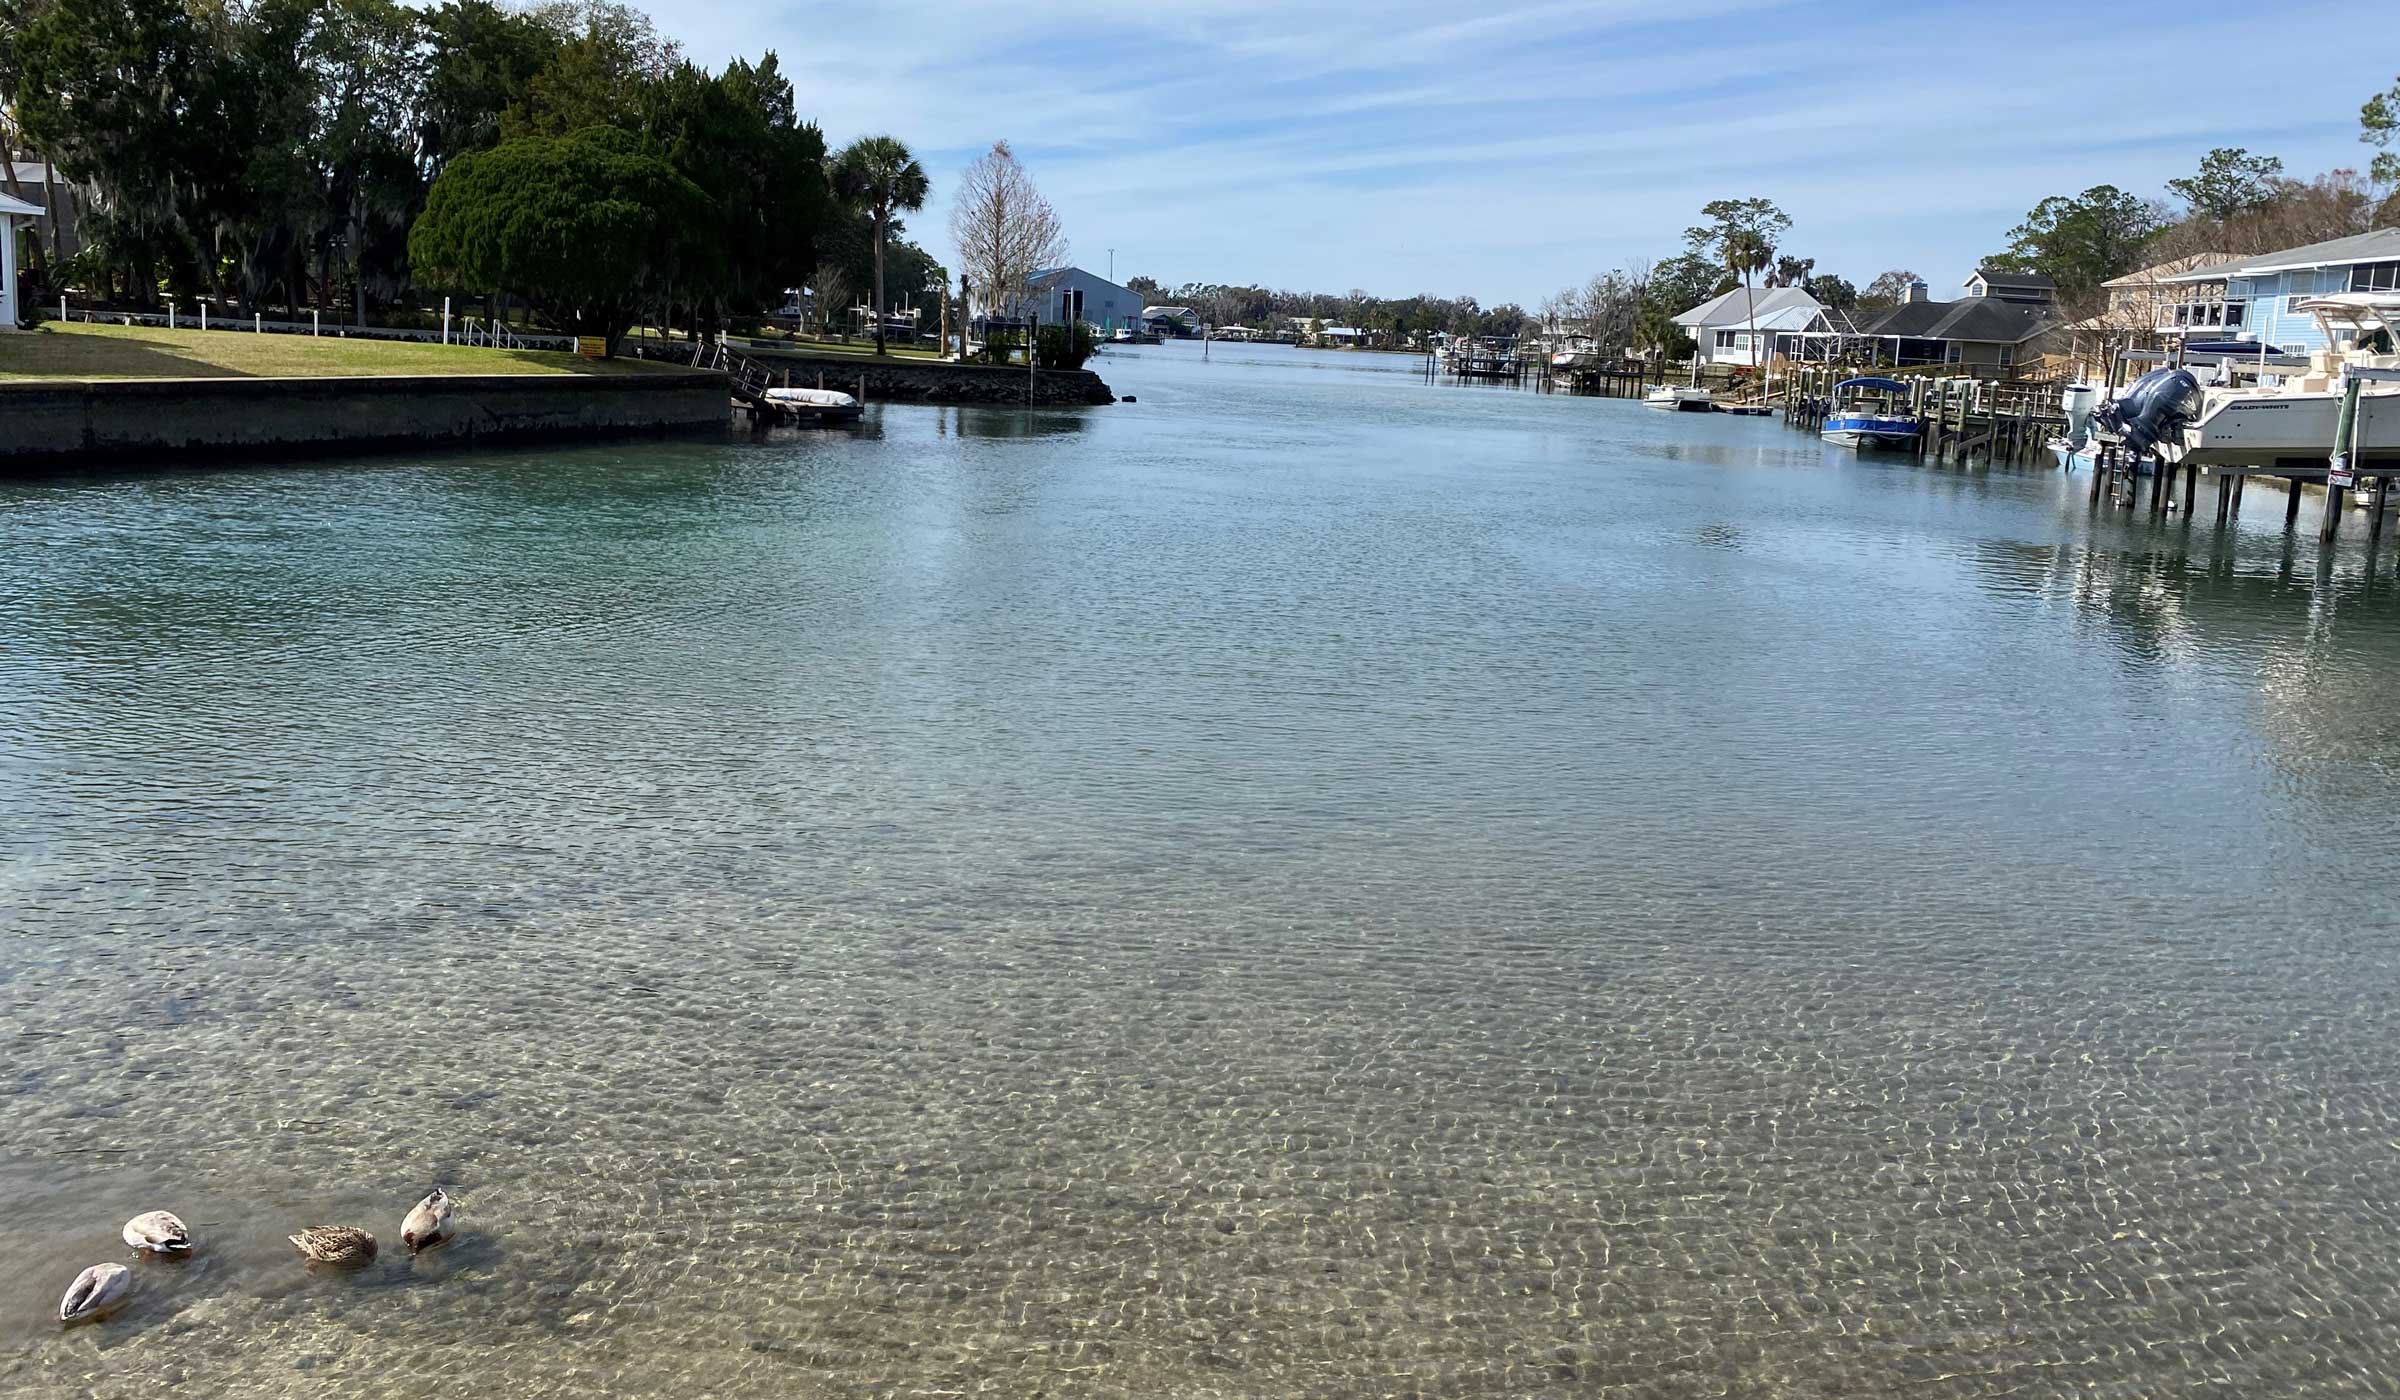
Between 1950 and 1980, the physical features of Kings Bay and Crystal River were dramatically altered with dredged canals, seawall installation, and the construction of residential and commercial properties. These activities changed water circulation in the bay and replaced much of the natural shoreline and adjacent wetlands.
Similarly, the previously natural lands of the springshed experienced substantial agricultural and urban land use conversion, which contributed nitrate to the springshed. Nitrate concentrations are higher compared to historical concentrations for many springs of the Crystal River/Kings Bay. These elevated concentrations can have adverse effects on the ecosystem. Long-term spring flow is largely affected by rainfall patterns and to a lesser extent by groundwater withdrawals. The Crystal River/Kings Bay system has an adopted Minimum Flows and Levels (MFL). An MFL is the limit at which further withdrawals would be significantly harmful to the water resources or ecology of the area.
Invasive aquatic vegetation species were introduced in the 1960s and became abundant to the point of impeding boat navigation. Mechanical removal and even sulfuric acid treatments were used to control these species, but it is likely that saltwater storm surges in the 1990s and early 2000s nearly eradicated these saltwater-intolerant invasive species, which have never returned to their prior abundance. Algal species, such as Lyngbya and Chaetomorpha, became more abundant after the decline of the invasive vegetation. Recent community-led efforts have sought to return native submerged plants to the bay. Current changes in vegetation are likely due to a variety of reasons such as salinity and sediment accumulation.
Unique Features
The presence of the tidally-influenced Kings Bay makes this system unique. On average, the bay ranges in depth from 3 to 10 feet and has two types of circulation patterns. Water in the northern part of the bay flows and flushes more rapidly and has a more direct connection to Crystal River. Springs located in this portion are typically fresh. Water in the southern, open-water portions of the bay is more estuarine, and many of the springs located in this region are brackish. This phenomenon makes the bay unlike other spring systems in the state and a unique feature along the Springs Coast.
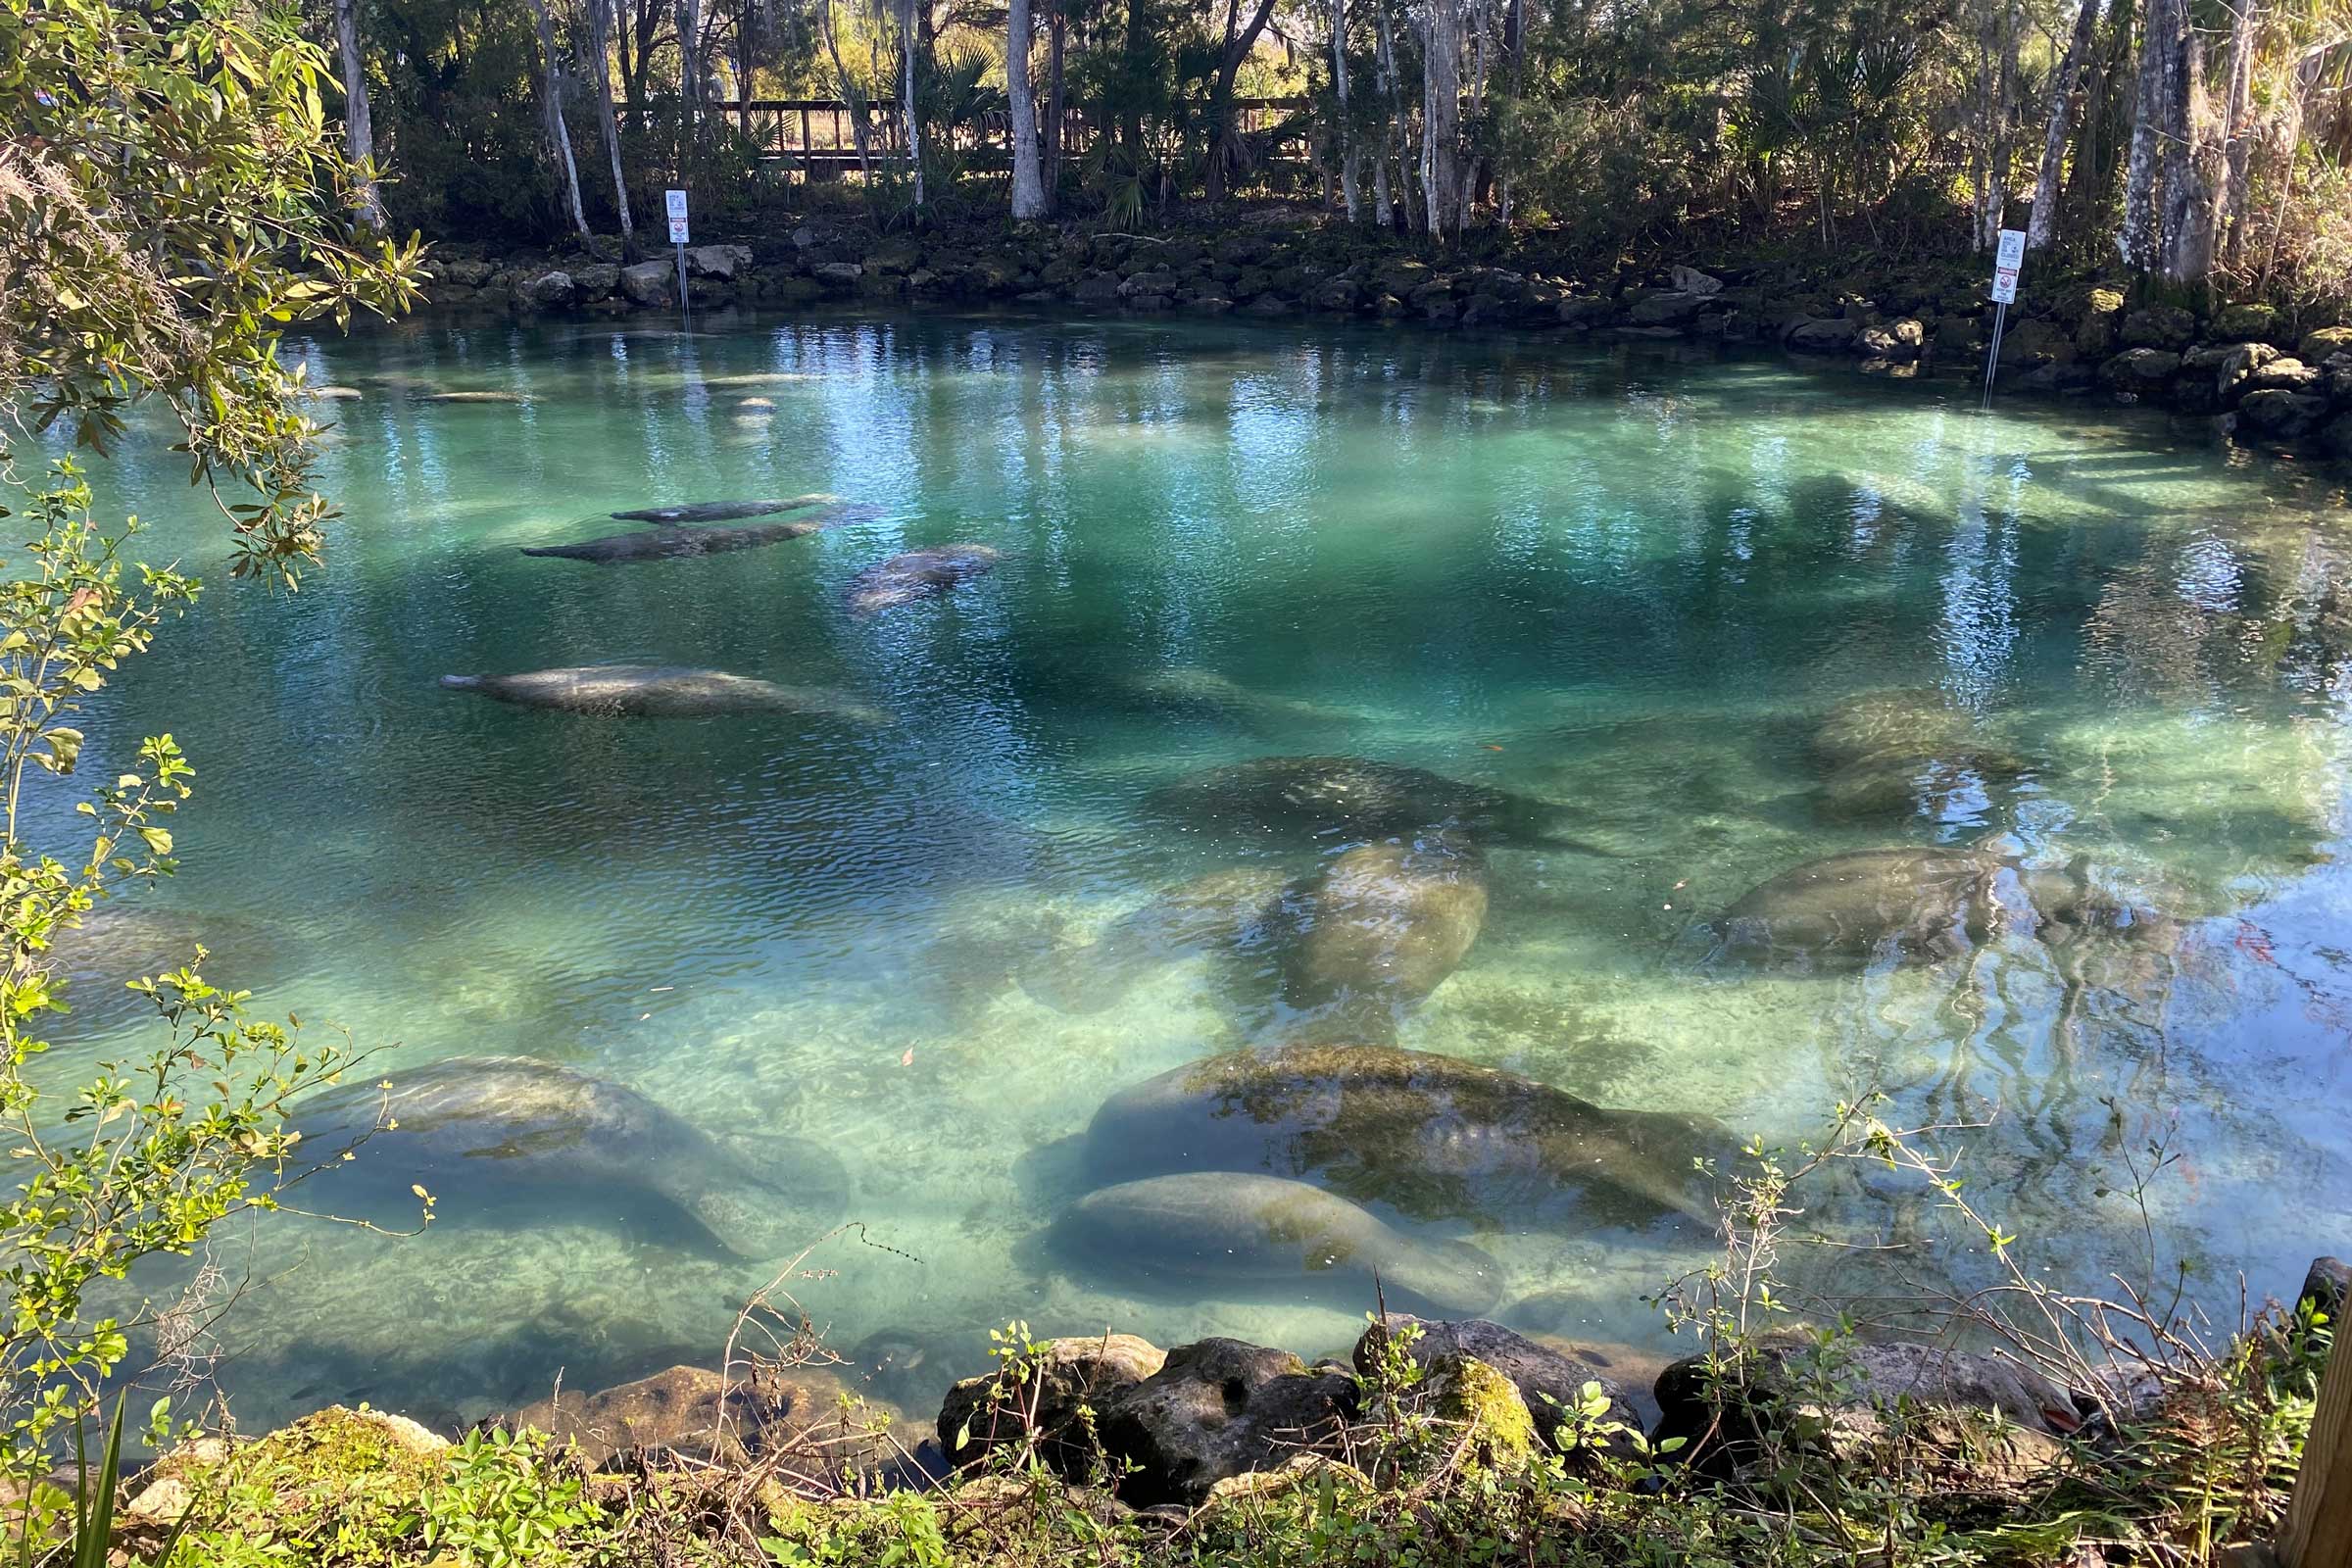
Crystal River/Kings Bay is well known for its manatees, with the City of Crystal River called the Manatee Capital of the World. Manatees enjoy a year-round presence, and several hundred manatees can be spotted during winter.
The Crystal River National Wildlife Refuge was established in 1983 and is the only refuge created specifically to protect the Florida manatee. When the Gulf of America waters drop below 68°F, hundreds of manatees move to the shallow springs of Kings Bay to escape the colder waters of the Gulf of America. The U.S. Fish and Wildlife Service (USFWS) has designated some of the springs in Kings Bay as manatee sanctuaries and may temporarily close some areas to protect these wintering manatees. One of the popular manatee sanctuaries is near Three Sisters Springs.
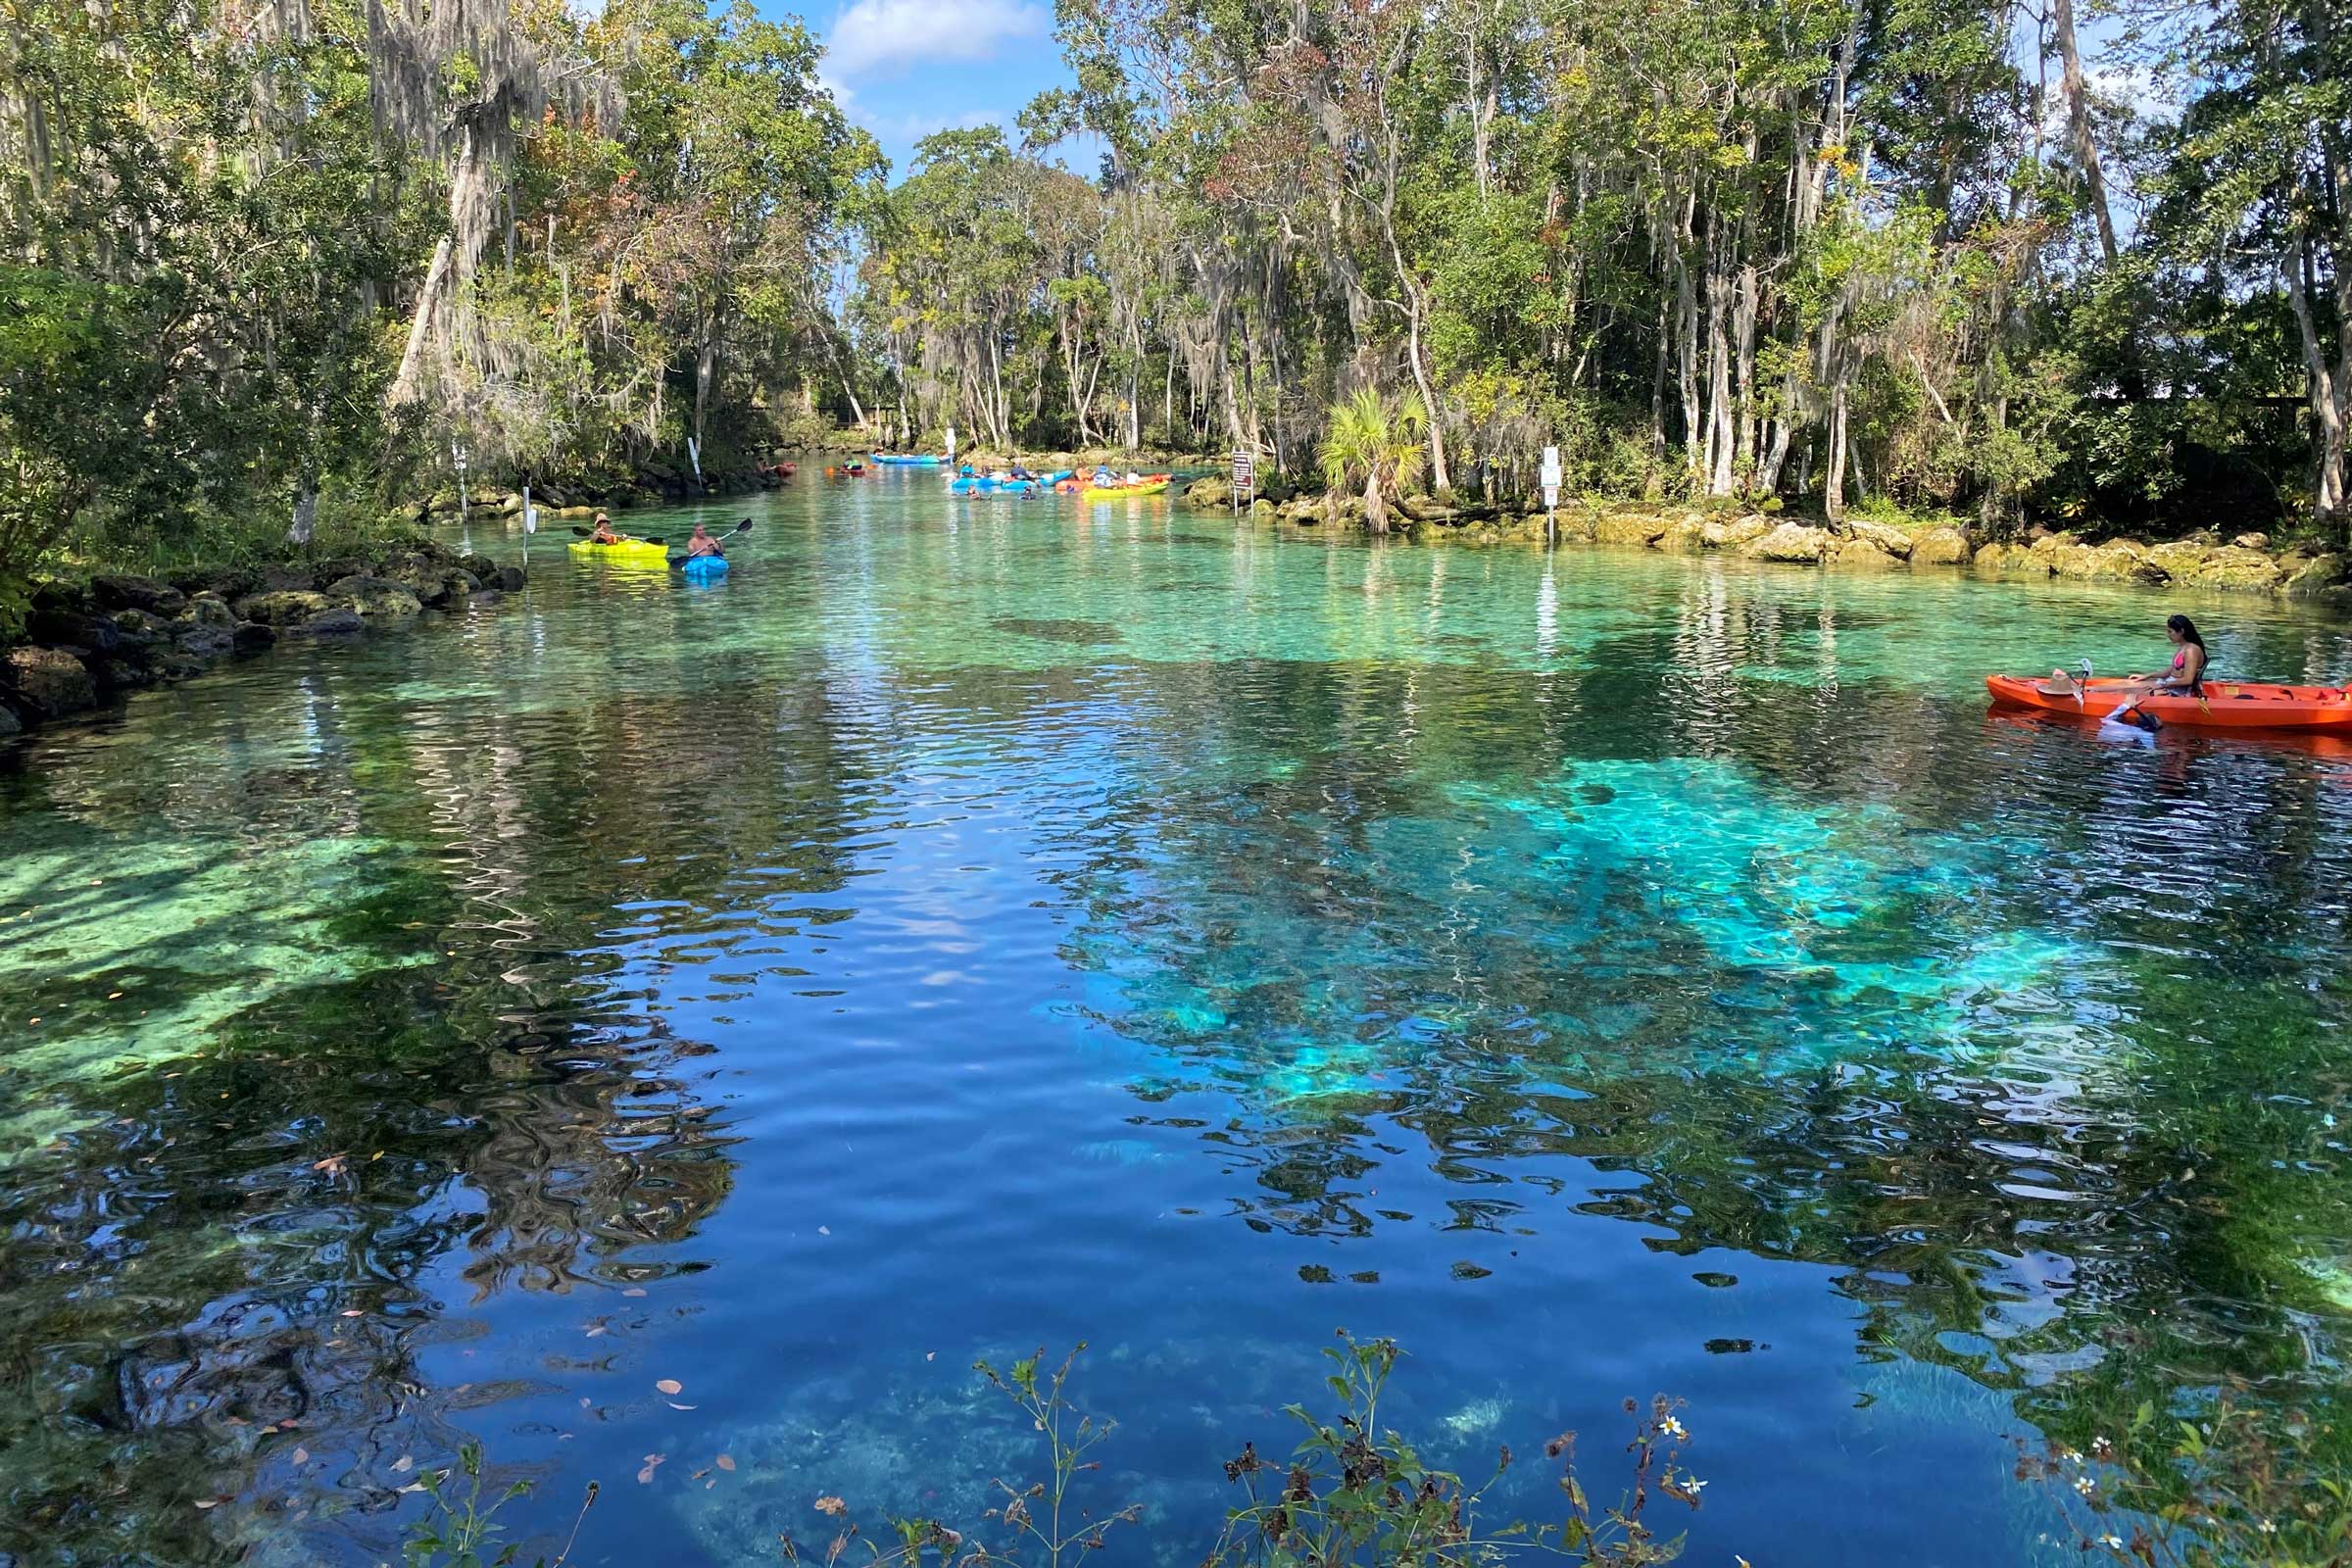
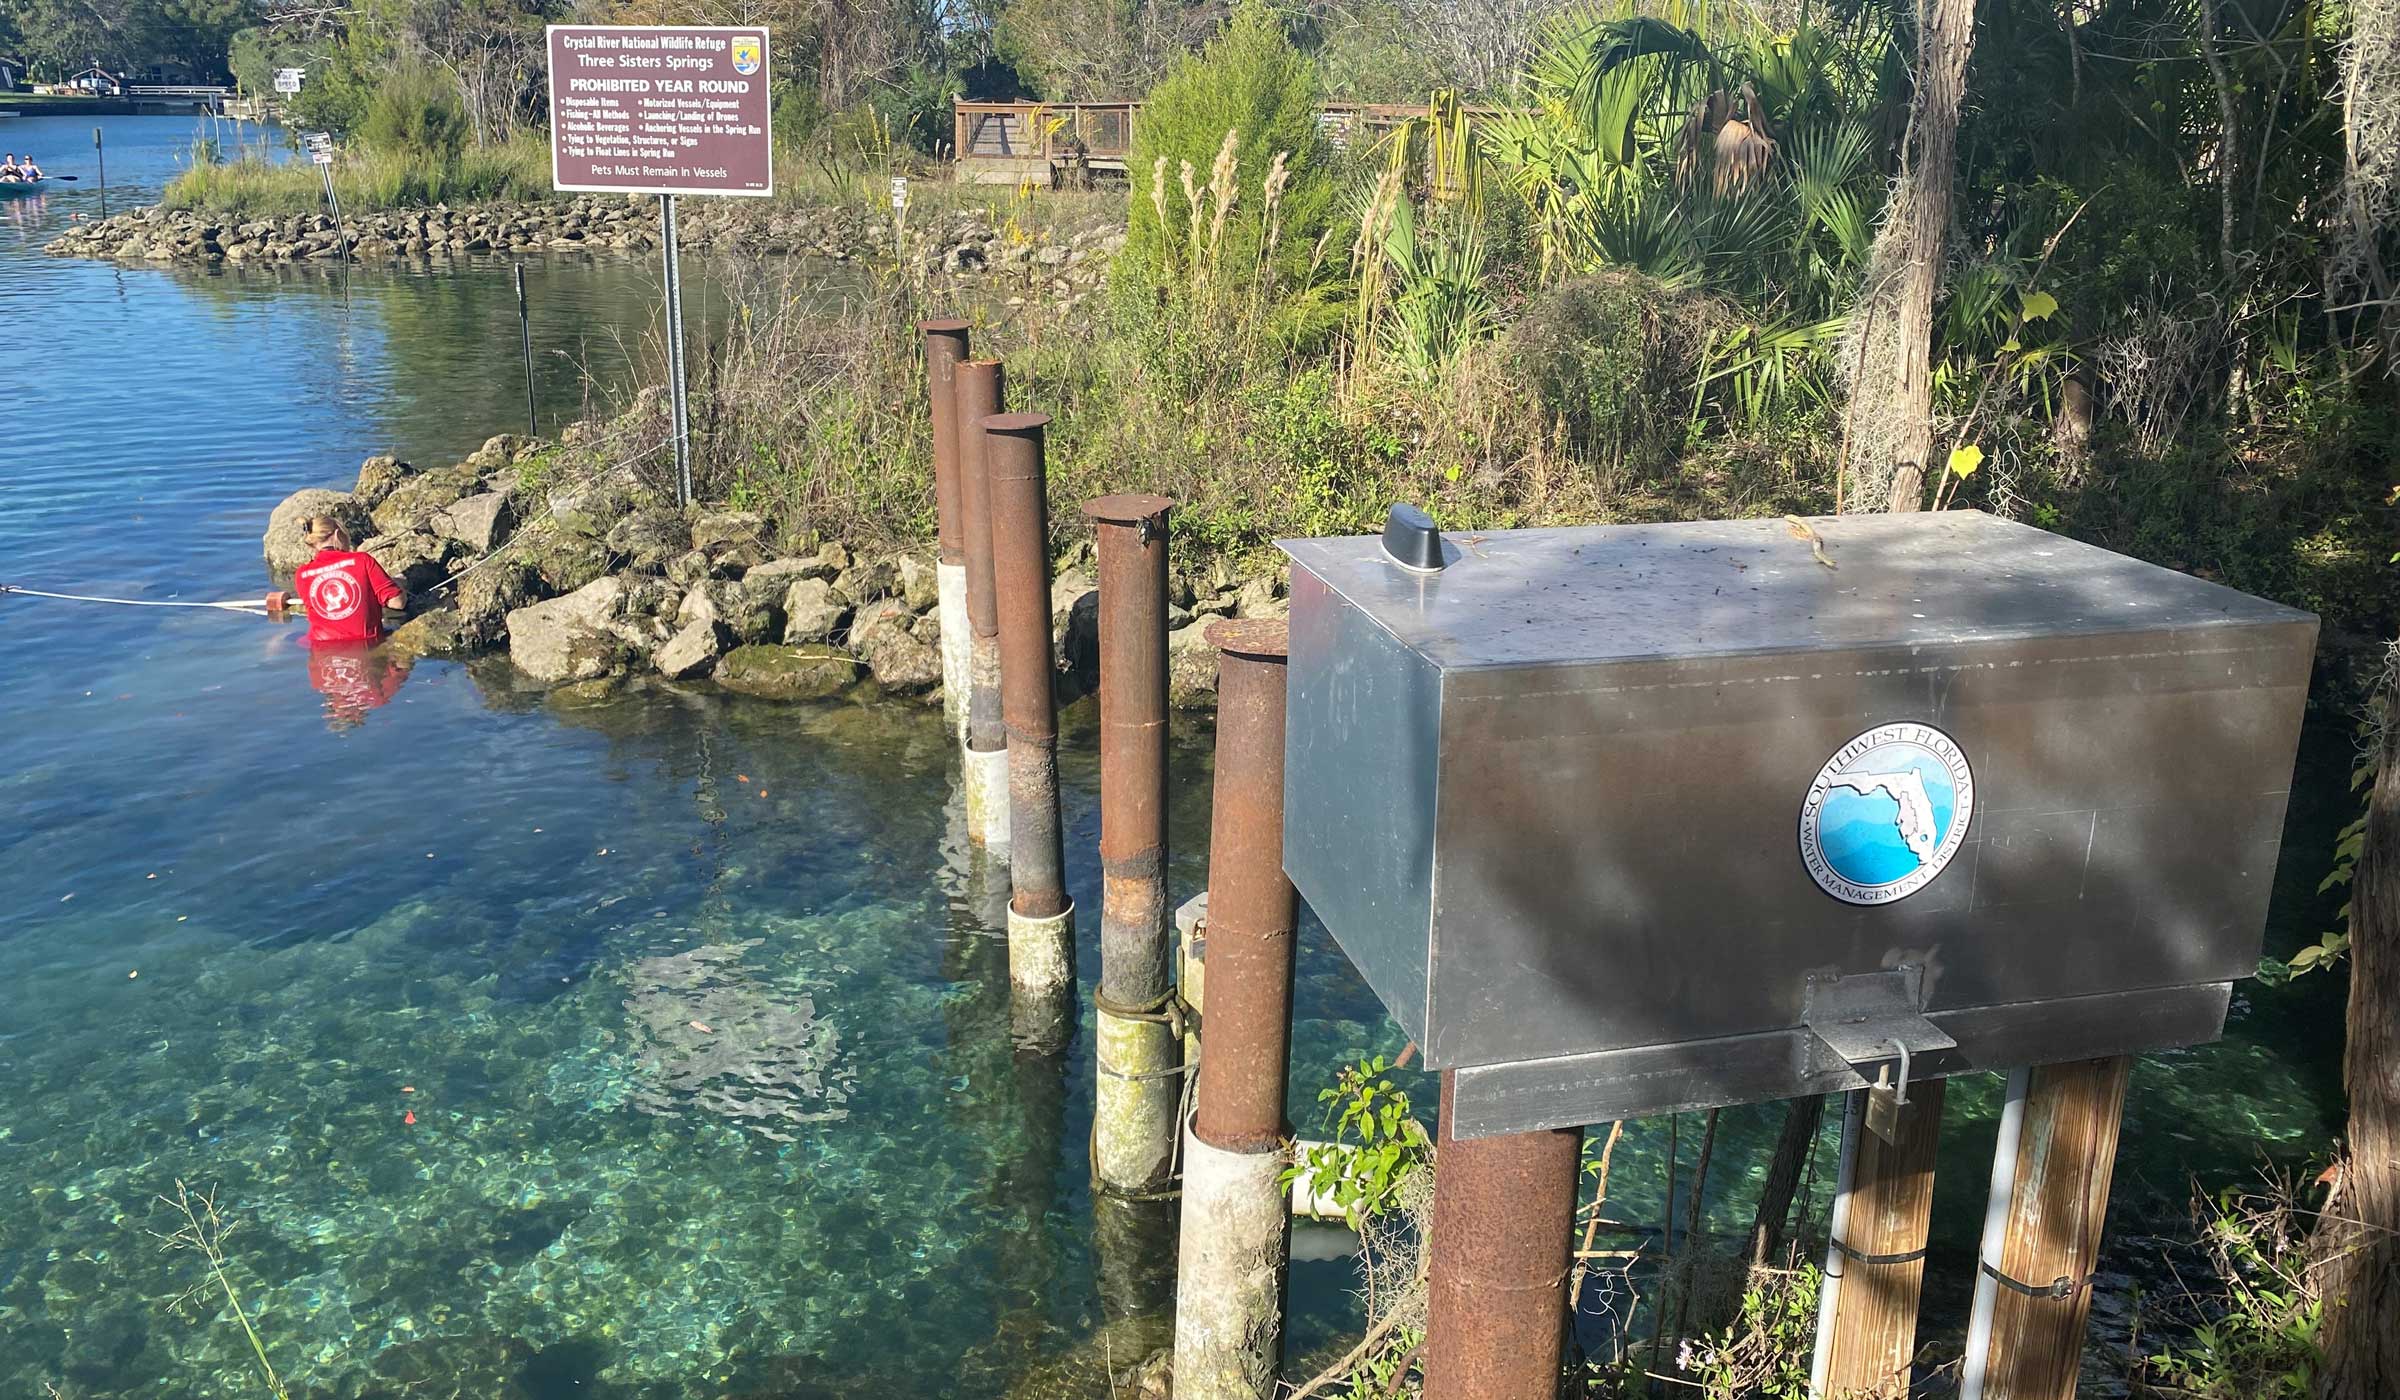
Three Sisters Springs is a complex of multiple spring vents in a clover-like arrangement. The three “sisters” of Three Sisters Springs include Pretty Sister Spring, Big Sister Spring (sometimes called Deep Sister Spring) and Little Sister Spring. These springs form a short, shallow run that connects to a canal that leads to Kings Bay. At the confluence of the canal and the spring run are several more spring vents which are referred to as Idiots Delight.
The Three Sisters Springs property, which is a 57-acre parcel, was acquired to protect the springs and the surrounding wetlands from development. It is co-owned by the District and the City of Crystal River and is managed by the City of Crystal River and the U.S. Fish and Wildlife Service. The District has completed several water quality and natural systems restoration projects on the property to mimic the benefits of the wetlands that were present prior to the dredge-and-fill activities that occurred in the 1960s and 1970s.
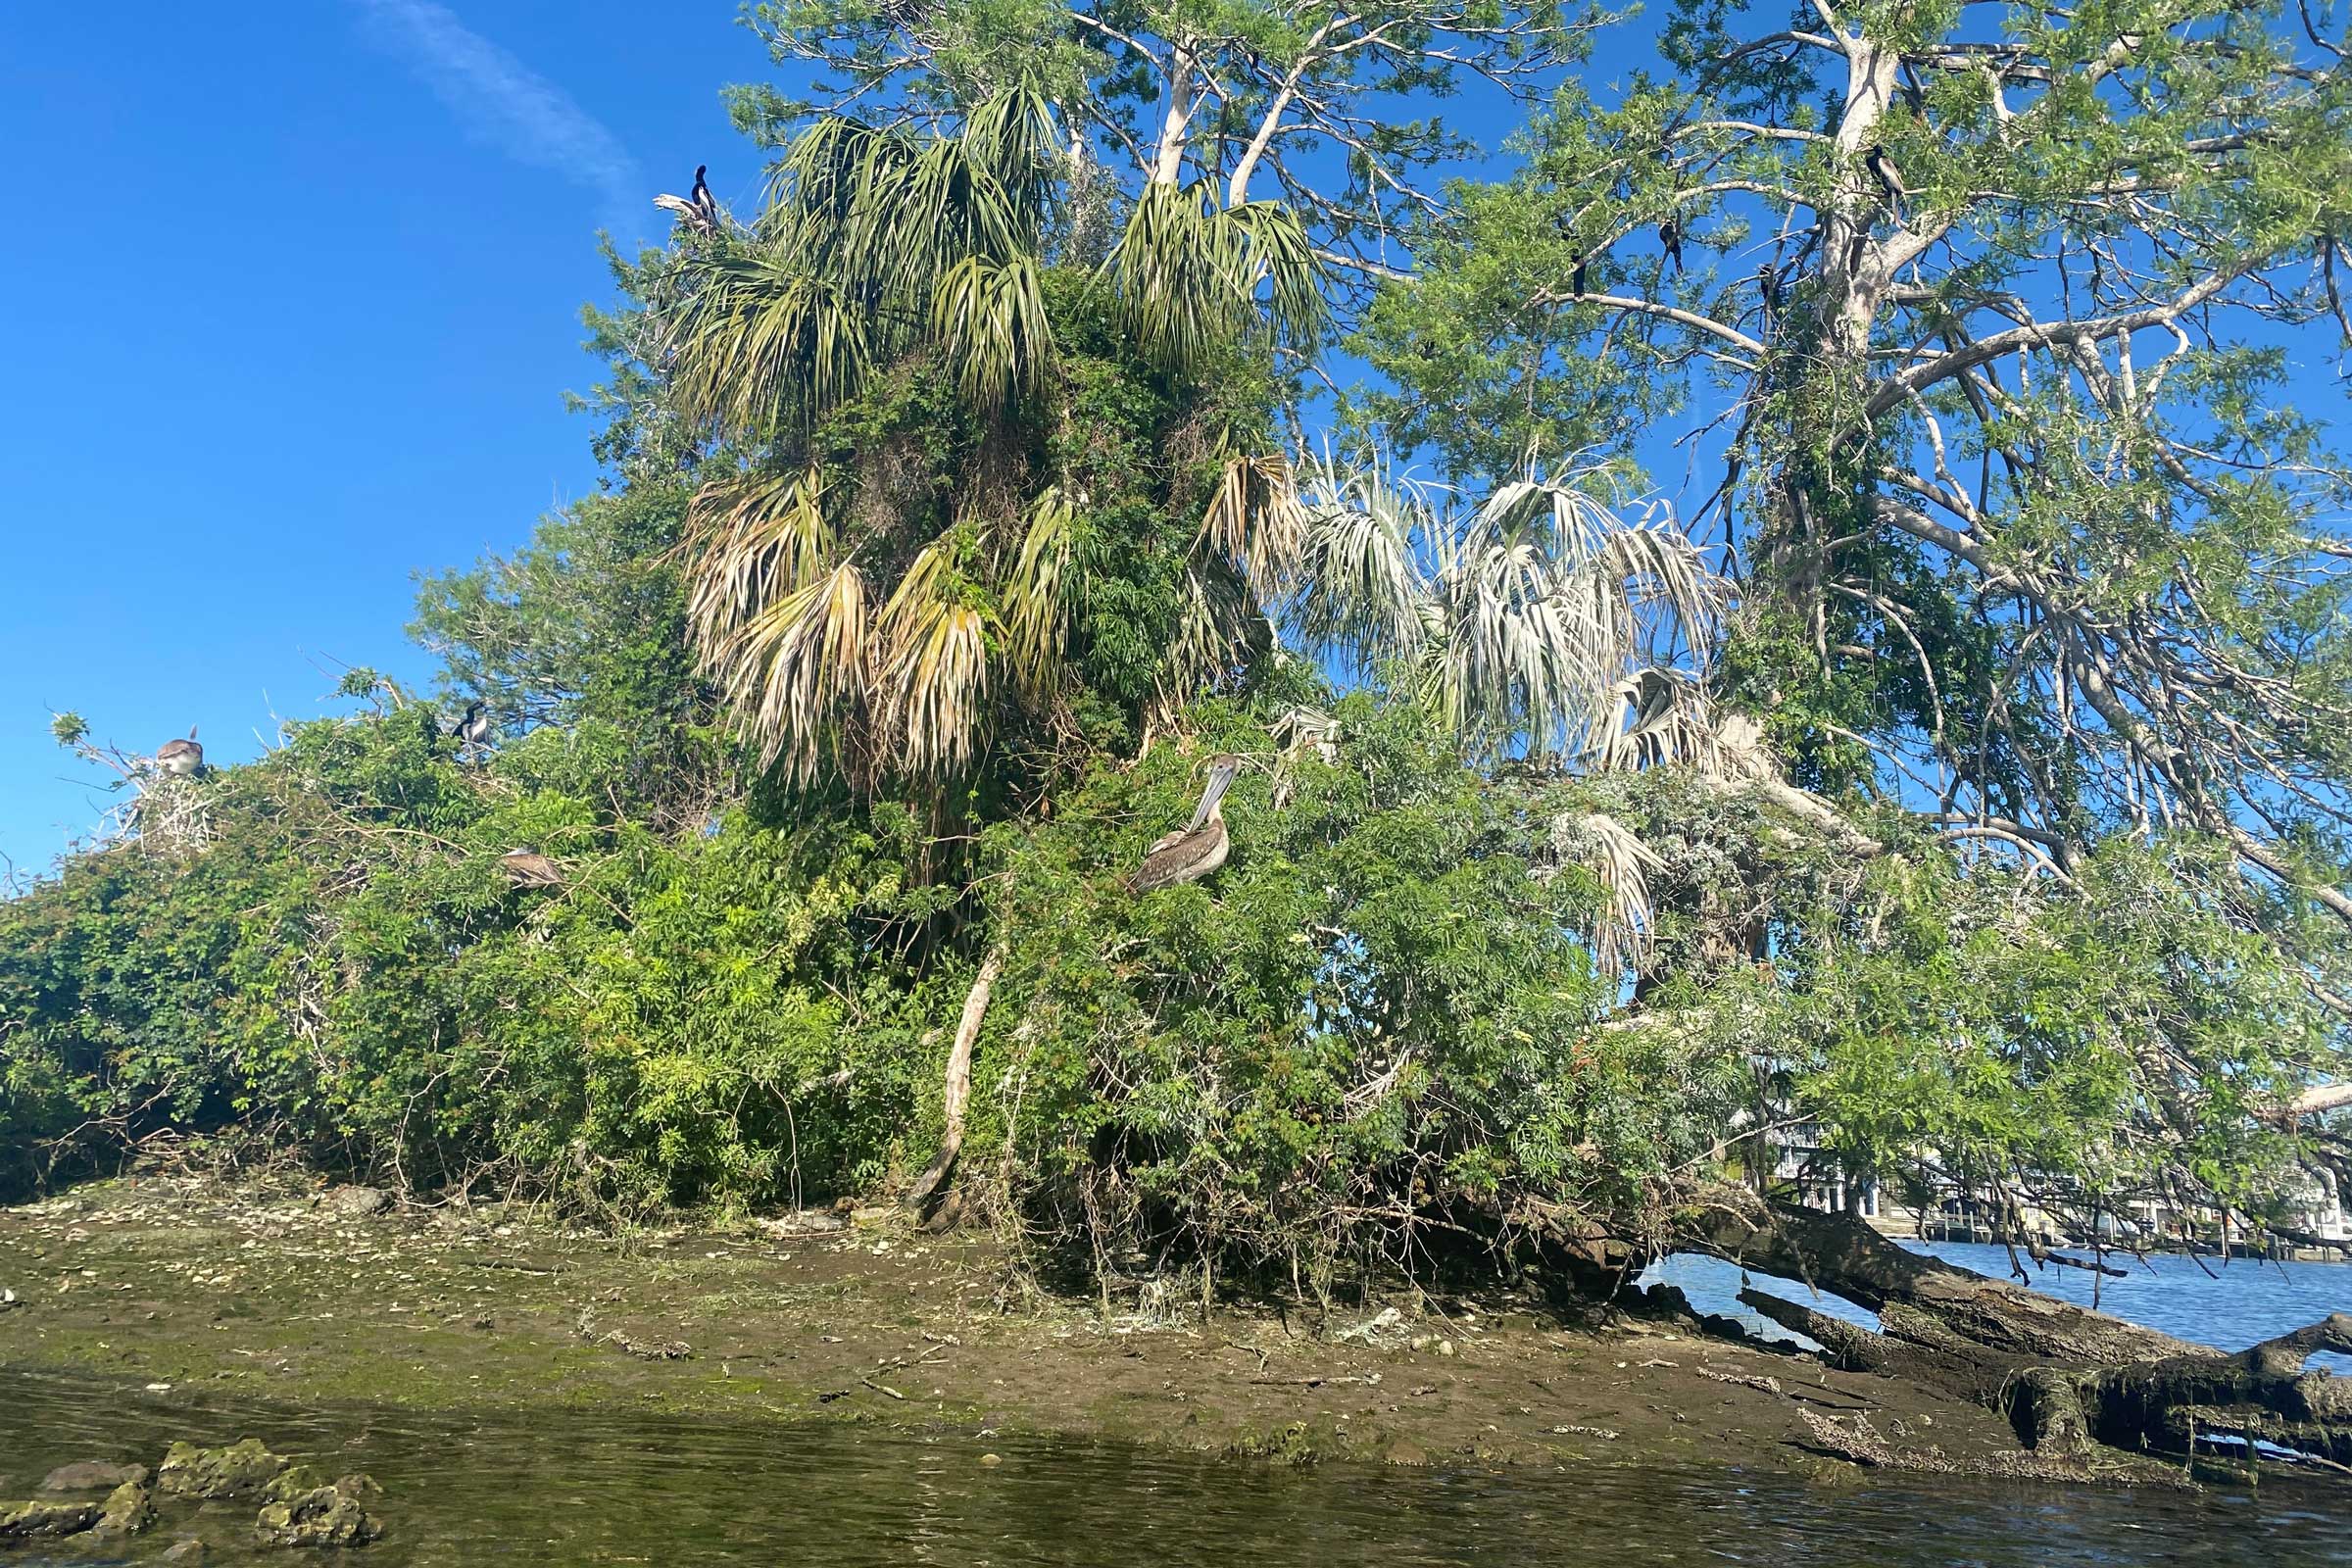
Kings Bay is home to a mixture of fish and wildlife that utilize the variable water conditions. Both freshwater and saltwater fish are present in the bay, including largemouth bass, snook, mullet, catfish, and tarpon. Visitors can also spot manatees, cormorants, stingrays and even bull sharks swimming in the bay.
Gallery
Click on any of the thumbnails to view the gallery slideshow.