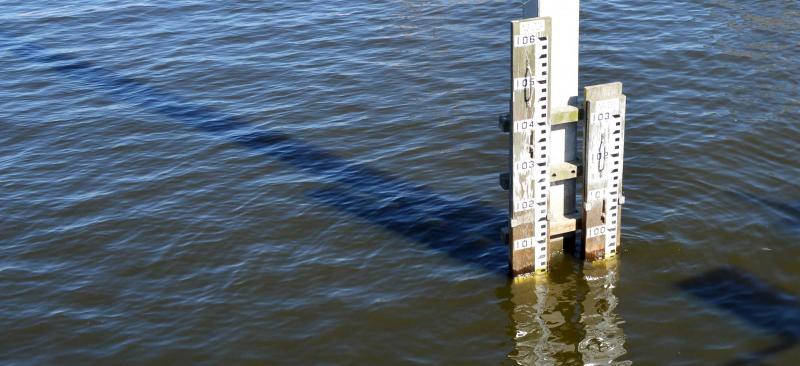
Historical Groundwater and Surface Water Levels, Rainfall and Evapotranspiration Data
Last-Recorded Value App »
Find the most recent water level or rainfall value for data collection sites.
Daily Hydrologic Data »
Updated every morning, this report contains the most comprehensive information on the current month’s rainfall and water levels at select stations.
Rainfall Data by Region »
Monthly, yearly and seasonal average rainfall totals available by time period and selected geographic area from 1915 to present. Data are updated monthly.
The Environmental Data Portal (EDP) is the District’s official database of groundwater and surface water levels, flows, water quality, and atmospheric data such as rainfall, wind direction and temperature. The EDP also provides specific information about data collection sites such as location and well construction details.
Near Real-Time Groundwater and Surface Water Levels and Rainfall
Near-Real-Time App »
Find current water levels and rainfall from our near-real-time system.
Reports
The District regularly monitors rainfall, aquifer conditions and structure operations throughout the region. The most up-to-date information is reflected in routine reports.
Water Control Structure Report »
This daily report provides the status of the District’s structures and water levels.
Hydrologic Conditions Report »
The Hydrologic Conditions Report is generated monthly and provides a summary of regional variations in hydrologic conditions for planning and regulatory purposes.
Aquifer Resource Weekly Updates »
The weekly report provides information to the public about the health of the water resources including rainfall values and aquifer levels.
Water Resource Monthly Updates »
The monthly report provides information to the public about the health of the water resources including rainfall values and aquifer and surface water levels.
Monthly Rainfall Maps and River Flows »
A comparison of recent rainfall to statistical averages. The data include one-, two- and three-year rainfall accumulation maps. Rainfall maps are updated monthly. River flows are provided by the United States Geological Survey’s National Water Dashboard.
Map Book: Upper Floridan Aquifer Potentiometric Surface - This SWFWMD map series consists of a 24” x 36” PDF map for each May and September beginning in September 2011.
Other Hydrologic Data Sources
In addition to the District’s hydrologic monitoring data, the following are links to other sources of hydrologic information.
USGS Investigative Report – Creating a monthly time series of the potentiometric surface in the Upper Floridan aquifer, Northern Tampa Bay area, Florida, January 2000-December 2009 »
Long-term groundwater monitoring data were used to generate a monthly time series of potentiometric surfaces in the Upper Floridan aquifer over a 573-square-mile area of west-central Florida between January 2000 and December 2009. The mapping time series describes the potentiometric surface beneath parts of six regionally important stream watersheds and 11 municipal well fields that collectively withdraw about 90 million gallons per day from the Upper Floridan aquifer. Includes links to an animation and GIS downloads for the modeled results.
A 34-year and nine-month time series of monthly-average potentiometric surfaces from January 1990 to September 2024 improves on the previous time series of Lee and Fouad (2017). The elevation of the potentiometric surface in the Upper Floridan aquifer is mapped in a 573-square-mile area spanning 11 municipal groundwater pumping well fields in the Northern Tampa Bay area. Data products include monitoring-well characteristics, time series of groundwater levels in monitoring wells, and GIS mapping downloads for modeled results. Download full .zip archive (710mb) »
Tributary streams in the Northern Tampa Bay area flow through thousands of freshwater wetlands before flowing into Tampa Bay, the Anclote River, Pithlachascotee River, and Cypress and Trout Creeks. The Wetland Ranking project maps wetlands that are part of flowing stream channels in different months of the year, then quantifies wetland outflows and other wetland surface-water metrics through time. The inundation potential of wetlands is ranked by combining wetland surface-water metrics with wetland groundwater metrics developed in a previous Wetland Groundwater Conditions project. Monthly-average wetland outflows, surface-water metrics, and inundation-potential rankings are described for the historical period 1950 to 2017, as well as for two shorter periods bracketing years before and after reductions in groundwater pumping within Tampa Bay Water well fields. A report describes the study. A data download includes a geodatabase and provides wetland metrics, inundation-potential rankings, and field-site verification data. Download full .zip archive (208mb) »
The Wetland Groundwater Conditions project maps monthly groundwater conditions at 10,516 wetlands in the Northern Tampa Bay area from January 1990 to December 2015. The groundwater condition metric is the vertical elevation difference (in feet) between the potentiometric surface in the Upper Floridan aquifer and the land surface of the wetland. Positive values, when the aquifer potentiometric surface is above the wetland land surface, convey discharging groundwater conditions. Negative values, when the potentiometric surface falls below land surface, convey recharging groundwater conditions. Wetlands are in a 581-square-mile area where the aquifer potentiometric surface is affected by groundwater pumping from 11 municipal well fields. Download full .zip archive (69.1mb) »
USGS Groundwater, Surface Water (Flow and Level) and Water Quality Data »
The U.S. Geological Survey currently operates more than 550 data collection sites in Florida for acquiring information on surface water, groundwater, water quality, and precipitation. Many sites are equipped with satellite telemetry, which allows the data to be posted to the website for public dissemination. Data are updated at frequencies ranging from 15 minutes to daily.
USGS GOES Potential and Reference ET Project and Data »
Reference and potential evapotranspiration are computed at a 2-kilometer spatial resolution and daily timestep for the State of Florida, including both land and lakes surfaces. Data and metadata are provided for each calendar year.
National Oceanic and Atmospheric Administration (NOAA) Climate Data Center »
The NOAA Climate Data Center is the world’s largest active archive of weather data. The climate data center produces numerous climate publications and responds to data requests from all over the world. Data is updated at varying schedules.
National Weather Service Forecast Office — Tampa Bay Area »
The NWS office in Ruskin, FL, provides a resource for short-term climate forecasts, flooding warnings and regional climate data archives.
USGS Water Watch »
The U. S. Geological Survey’s Water Watch presents statistical evaluations of hydrologic data in a historical context that supports drought and flood monitoring.
Southeast River Forecast Center »
The Southeast River Forecast Center provides statistical evaluations of near real-time rainfall and streamflow to assist in flood monitoring and prediction. Additional climate analysis and forecast products are also available.
U.S. Drought Portal »
The National Integrated Drought Information System is a summary of national and local drought conditions and forecasts.
Florida Forest Service Daily Rainfall Reports »
Daily rainfall totals for Florida Forest Service observations sites.
Florida Automated Weather Network (FAWN) »
Access the University of Florida/IFAS monitoring network for near-real-time rainfall, ET, and related parameters at 40+ weather stations throughout Florida.