Water utilities can reduce per capita water use and maintain revenues by using water-conserving rate structures. Your water management district can provide information and tools to help utilities accomplish these goals.
Why Use Rates to Conserve?
In many areas of Florida, water supplies are stressed as growth fuels new demand for water. To ensure a sustainable water supply, utilities are tapping alternative sources including conservation. The pricing of water is one way to motivate customers to conserve. Appropriately designed water pricing can:
- Reduce water consumption without negative impacts on utility revenues;
- Reward customers for making cost-effective changes in water appliances and behavior through greater savings;
- Target inefficiency in discretionary water uses such as landscape irrigation;
- Delay costly water supply expansion projects; and
- Avoid financial hardships on low-income customers.
Study Evaluates Water Rates
Four Florida water management districts funded the largest study ever conducted of how water rates affect single-family residential water use. Participating utilities included the cities of Lakeland, Melbourne, Ocoee, Palm Coast, St. Petersburg, Tallahassee and Tampa; the counties of Escambia, Hernando, Hillsborough, Indian River, Palm Beach, Sarasota and Seminole; Miami-Dade Water and Sewer Department; and the Toho Water Authority.
Study Findings
- Water use decreases with increases in water price. The decreases are predictable and statistically valid.
- Price-induced changes in water use vary with property value and the availability of substitute water sources such as irrigation wells, ponds and canals.
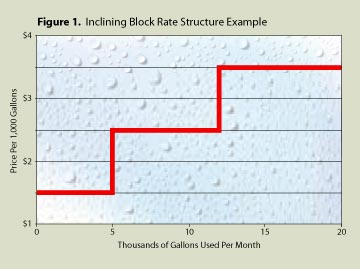
- Without decreasing revenues, utilities can lower water use by using inclining block rates, that is, water price increases with increasing blocks of water use (see Figure 1).
- Fixed charges do not encourage conservation. Utilities can lower water use by lowering fixed charges and increasing charges based on how much is used.
- Customers need more pricing and water use information included on the bill, such as how their use compares to the utility’s average residential use.
Per Capita Usage For All Property Value Profiles Reduced
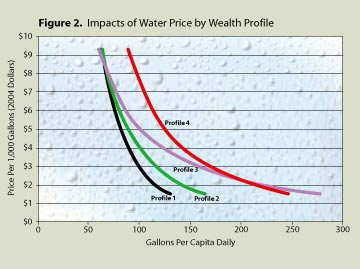
The study divided single-family residential water customers into four profiles based on assessed property values of homes, with Profile 1 being the homes with the lowest assessed value and Profile 4 the highest.
Figure 2 shows that as water price increases, per capita water use decreases for all profiles. It is clear that people in more expensive homes use more water. However, price increases tend to reduce their water use at a greater rate than other profiles because they use more water for discretionary purposes, such as landscape irrigation.
How Much Can Be Saved?
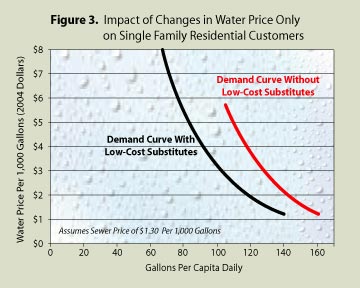
Based on the study sample, Figure 3 provides an example of how changes in water price impact total
single-family residential per capita water use. (Actual reductions vary by utility and can be easily modeled as noted below.) The demand curve on the left illustrates that when homes have access to substitute water sources like irrigation wells, increasing the price from $1.20 to $2 per thousand gallons reduced single-family residential per capita water use from 140 to 116 gallons (17%). The decrease is the result of both conservation and the movement of some customers to a substitute source.
The demand curve on the right illustrates the results of the same price increase on customers without access to low-cost substitute sources. In that case, the per capita use dropped from 161 to 140 gallons (13)%. Customers without access to substitute water sources tend to be less price sensitive than those with access.
Is Your Rate Structure All That It Can Be?
Although most Floridians face increasing block rates, these rates can often be redesigned to further maximize conservation and still maintain revenues. For many utilities, prices in lower volume blocks can be reduced and the prices in higher volume blocks increased. Utilities can also decrease fixed charges and increase charges based on the amount of water actually used.
Estimate Your Savings — It’s Easy and Free
The effectiveness of a water-conserving rate structure depends on how well it’s designed. Each utility has a unique mix of single-family residential profiles and other customers and circumstances to consider.
We’ve made it easy by creating a water rate simulation model that a utility can use to input its own mix of property value profiles, availability of substitute sources, current and proposed water and sewer rates and revenue requirements. The model produces projected water use and revenue tailored specifically for your utility. The model also allows utilities to model the impacts of price changes on multi-family and commercial customer classes. Best of all, it’s free to any utility within the four sponsoring water management districts.