A change in the global weather pattern in 2016 meant residents also saw a change in rainfall patterns. Most areas of the District saw above-average rainfall in the first part of the year caused by a mild El Nino. But the development of a La Nina cycle caused drier-than-normal conditions the second half of the year.
The La Nina event is expected to dissipate by February, and climatic conditions are expected to turn to neutral conditions. That means rainfall patterns aren’t as predictable as those of 2016, according to Granville Kinsman, the District’s hydrologic data manager.
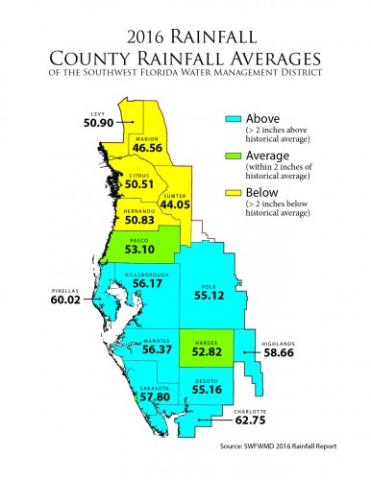
The District saw significant differences between its regions in 2016. The northern counties of the District averaged a total of 48 inches, about 5 inches below the historical average. While the southern counties in the District averaged about 57 inches, or about 4 inches above historical averages.
The District encourages water conservation year-round, particularly when rainfall patterns may not be easily predictable. Kinsman especially encourages conservation for the northernmost counties, with its below-normal averages. Efficient, non-wasteful uses of water are encouraged in order to sustain the District’s high quality of life. More information can be found by visiting WaterMatters.org/Conservation for water conservation tips and WaterMatters.org/DailyRainfal for rainfall data.
Two new data viewers also are available for rainfall data at WaterMatters.org/Data/Hydrologic. The Last Recorded Value App shows the most recent water level or rainfall value for data collection sites. The Near-Real-Time App shows the current water levels and rainfall with updates every half hour. Both of these data viewers now show the data directly on maps allowing residents to search for areas near them and in real time.