The District recently launched a new resource for rainfall and river data.
The new Hydrologic Data Page features daily rainfall and river flow information in an easy-to-read format. The page provides a summary of daily and month-to-date rainfall totals at 89 collection sites in the District.
The page debuted a day after Tropical Storm Andrea formed in the Gulf of Mexico and was an instant hit on social media as users could keep track of area rainfall totals from the storm.
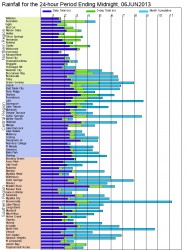
On the page, users will find a site map showing the location of each measurement station. Plus, a rainfall chart gives a summary of daily, three-day and monthly accumulations in inches. The page also features a daily rainfall table with the exact amount collected at each station.
The page’s river data indicates the current river flow at 16 key monitoring sites, relative to their respective normal ranges. The flow measurements are provided by the U.S. Geological Survey.
Granville Kinsman, the District’s Hydrologic Data manager, said the page is another information resource for the public.
“This information always has been available,” he said. “Now, we have made it more accessible so people can know the hydrologic conditions around the District. We are continuing to work on making even more data easily available in the coming months.”