Chassahowitzka Springs Spring Dashboard
Current Conditions
Historical Average Rainfall
for April: 2.73
in
Actual Rainfall Received
for April: 0 in
Springshed Region Rainfall
This graph displays the moving 12-month rainfall total as measured within the Chassahowitzka Springs springshed since 1995. The area between the red and green lines is the expected normal range (between the 25th and 75th percentiles) of rainfall.
Stream Flow
Chassahowitzka River Stream Flow:
67 mgd (8/1/2022)
?This number is the most recent average daily estimate of how much water flows down the Chassahowitzka River and is measured in million gallons per day (mgd). The springs are affected by tides from the Gulf of Mexico and a single flow value will vary across a full tidal cycle. Nearly all of the river's stream flow is from groundwater sources, which come from the Chassahowitzka headsprings and other springs discharging into the river. For reference, one million gallons is enough water to fill about 100 residential swimming pools!
This graph displays the moving 12-month average of daily flow from the Chassahowitzka River headsprings since 1995. The area between the red and green lines is the expected normal range (between the 25th and 75th percentiles) of stream flow.
Nitrate Concentration
Nitrate Concentration:
0.70 mg/L (4/13/2022)
?This number is the most recently measured nitrate value in milligrams per liter (mg/L) from the Chassahowitzka 1 Spring vent. Excess levels of nitrate in water can be harmful to aquatic insects, amphibians and fish. If algae have an unlimited source of nitrate, excess growth may occur. Large amounts of algae growth can cause reduced water clarity and extreme fluctuations in dissolved oxygen, which is stressful to aquatic life.
This graph displays the levels of nitrate over time from the Chassahowitzka 1 Spring vent since 1995. The red line on the graph shows the statewide numeric nutrient criteria for nitrate levels in springs, which is 0.35 milligrams per liter (mg/L). Excess levels of nitrate in water can be harmful to aquatic insects, amphibians and fish. If algae have an unlimited source of nitrate, excess growth may occur. Large amounts of algae growth can cause reduced water clarity and extreme fluctuations in dissolved oxygen, which is stressful to aquatic life.
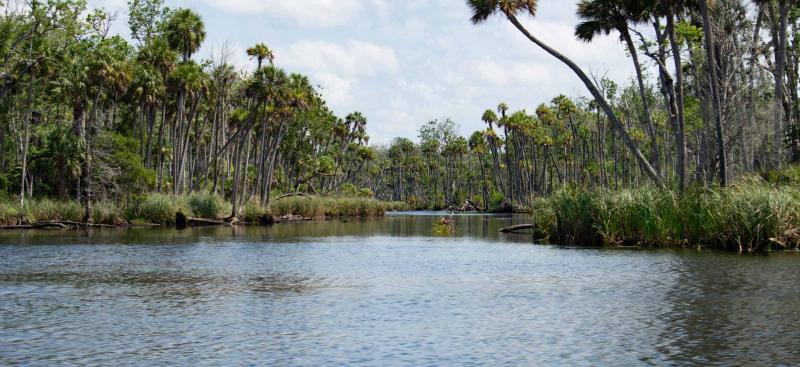
Location
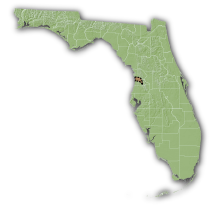
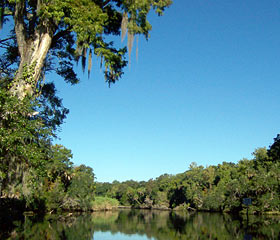
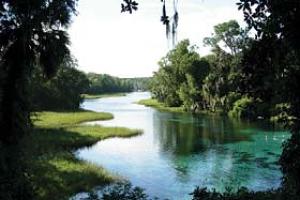
View of Chassahowitzka River looking downriver from headsprings. (Inset: State of Florida counties and Chassahowitzka Springshed location.)
Chassahowitzka Springs, Citrus County
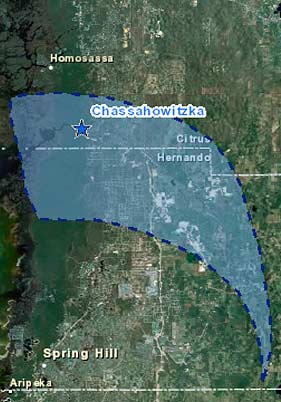
This map links to an interactive overview of the Chassahowitzka Springs springshed. When you zoom in on the Chassahowitzka River, the map also shows data collection sites associated with the information presented in the dashboard.
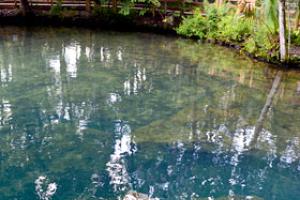
Clarity
Clarity at Headsprings:
20 feet (4/5/2022)
Clarity at Downriver Site:
4 feet (4/5/2022)
These two numbers represent the clarity of the water (how far you can see under water), in feet, in the Chassahowitzka Spring headspring and also at a location downstream. These measurements show how water clarity changes as you move further from the headsprings down the river. Based on these water clarity values, Chassahowitzka Springs typically has clear water, with measured distances of over 30 feet at the headsprings. Clarity at the headspring and the downstream river location are influenced by tidal effects from the Gulf of Mexico which introduce increased suspended solids into the water making it less clear than the waters of the District's non-tidal spring systems.
Interactive Land Use Map

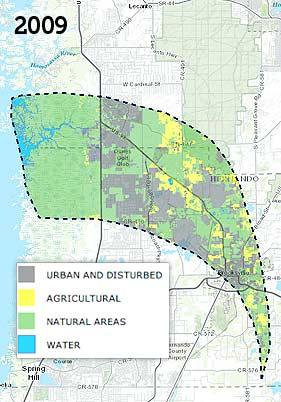
This map links to an interactive map of land use within the Chassahowitzka Springs springshed. The urban and disturbed category contains classifications such as residential, industrial and transportation. The natural areas category contains classifications including upland forested and nonforested areas, as well as wetlands. The main dashboard page displays a fade of both 1995 and 2009 land use. The interactive map initially displays 1995 land use, but allows for cycling through of the years 1995, 1999, 2004 and 2009 by use of the "Time" button and slider.